A semiconductor industry would like to find out whether worker hours are related to lot sizes. They wish to use the model to later predict the number of worker hours required for different lot sizes. The observed values are given below: 1. Lot size 20 20 30 30 40 40 50 50 60 Working hours 60 70 70 80 80 67 87 95 108 112 128 135 148 160 170 162 50 55 73 Find the estimated regression line to fit the data using the method of least squares. Interpret b, the slope of the regression line. a) b) b) Predict the number of worker hours needed for a lot of size 75.
A semiconductor industry would like to find out whether worker hours are related to lot sizes. They wish to use the model to later predict the number of worker hours required for different lot sizes. The observed values are given below: 1. Lot size 20 20 30 30 40 40 50 50 60 Working hours 60 70 70 80 80 67 87 95 108 112 128 135 148 160 170 162 50 55 73 Find the estimated regression line to fit the data using the method of least squares. Interpret b, the slope of the regression line. a) b) b) Predict the number of worker hours needed for a lot of size 75.

College Algebra
7th Edition
ISBN:9781305115545
Author:James Stewart, Lothar Redlin, Saleem Watson
Publisher:James Stewart, Lothar Redlin, Saleem Watson
Chapter1: Equations And Graphs
Section: Chapter Questions
Problem 10T: Olympic Pole Vault The graph in Figure 7 indicates that in recent years the winning Olympic men’s...

Related questions
Question
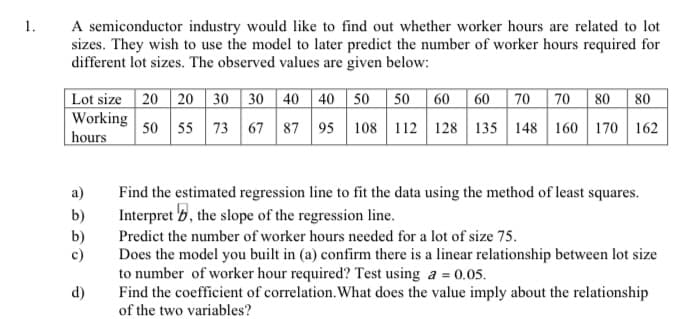
Transcribed Image Text:A semiconductor industry would like to find out whether worker hours are related to lot
sizes. They wish to use the model to later predict the number of worker hours required for
different lot sizes. The observed values are given below:
1.
Lot size 20 20 30 30 40 40 50 50 60
60 70 70
80 80
Working
| hours
50 55 73 67 87 95
108 112 128 135 148 160 170 162
a)
Find the estimated regression line to fit the data using the method of least squares.
b)
Interpret b, the slope of the regression line.
b)
c)
Predict the number of worker hours needed for a lot of size 75.
Does the model you built in (a) confirm there is a linear relationship between lot size
to number of worker hour required? Test using a = 0.05.
Find the coefficient of correlation. What does the value imply about the relationship
d)
of the two variables?
Expert Solution
This question has been solved!
Explore an expertly crafted, step-by-step solution for a thorough understanding of key concepts.

Step by step
Solved in 3 steps with 2 images

Knowledge Booster


Learn more about
Need a deep-dive on the concept behind this application? Look no further. Learn more about this topic, statistics and related others by exploring similar questions and additional content below.Recommended textbooks for you
College Algebra
Algebra
ISBN:
9781305115545
Author:
James Stewart, Lothar Redlin, Saleem Watson
Publisher:
Cengage Learning

Linear Algebra: A Modern Introduction
Algebra
ISBN:
9781285463247
Author:
David Poole
Publisher:
Cengage Learning

Glencoe Algebra 1, Student Edition, 9780079039897…
Algebra
ISBN:
9780079039897
Author:
Carter
Publisher:
McGraw Hill
College Algebra
Algebra
ISBN:
9781305115545
Author:
James Stewart, Lothar Redlin, Saleem Watson
Publisher:
Cengage Learning
Linear Algebra: A Modern Introduction
Algebra
ISBN:
9781285463247
Author:
David Poole
Publisher:
Cengage Learning
Glencoe Algebra 1, Student Edition, 9780079039897…
Algebra
ISBN:
9780079039897
Author:
Carter
Publisher:
McGraw Hill