A random sample of 841 births included 430 boys. Use a 0.05 significance level to test the claim that 50,7% of newbon babies are boys. Do the results support the belief that 50.7% of newborn babies are boys? Identify the null and alternative hypotheses for this test. Choose the correct answer below. YA. Ho:p= 0.507 H4: p+0.507 O B. Ho: p=0.507 H:p>0.507 OC. Ho: p=0.507 H:p<0.507 O D. Ho: p0.507 H:p=0.507 Identify the test statistic for this hypothesis test. The test statistic for this hypothesis test is. (Round to two decimal places as needed.)
A random sample of 841 births included 430 boys. Use a 0.05 significance level to test the claim that 50,7% of newbon babies are boys. Do the results support the belief that 50.7% of newborn babies are boys? Identify the null and alternative hypotheses for this test. Choose the correct answer below. YA. Ho:p= 0.507 H4: p+0.507 O B. Ho: p=0.507 H:p>0.507 OC. Ho: p=0.507 H:p<0.507 O D. Ho: p0.507 H:p=0.507 Identify the test statistic for this hypothesis test. The test statistic for this hypothesis test is. (Round to two decimal places as needed.)

College Algebra (MindTap Course List)
12th Edition
ISBN:9781305652231
Author:R. David Gustafson, Jeff Hughes
Publisher:R. David Gustafson, Jeff Hughes
Chapter8: Sequences, Series, And Probability
Section8.7: Probability
Problem 58E: What is meant by the sample space of an experiment?

Related questions
Question
Practice Pack
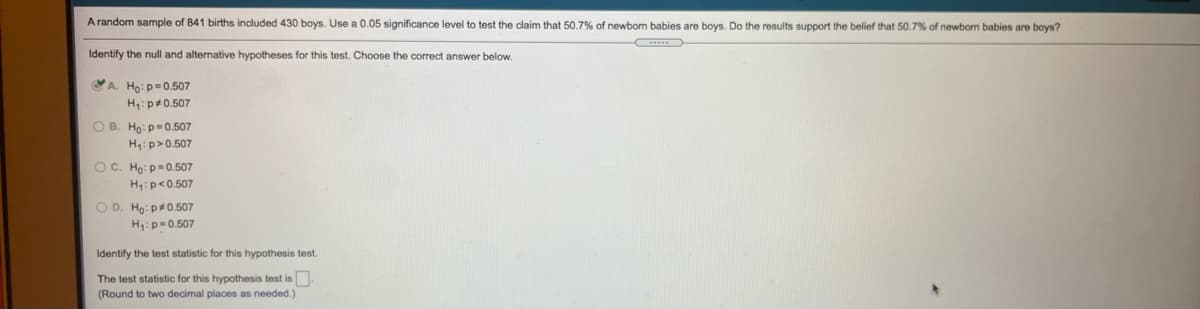
Transcribed Image Text:A random sample of 841 births included 430 boys. Use a 0.05 significance level to test the claim that 50,7% of newbom babies are boys. Do the results support the belief that 50.7% of newbon babies are boys?
Identify the null and alternative hypotheses for this test. Choose the correct answer below.
VA. Ho:p=0.507
H:p#0.507
O B. Ho: p=0.507
H:p>0.507
O C. Ho: p=0.507
H:p<0.507
O D. Ho: p+0.507
H:p=0.507
Identify the test statistic for this hypothesis test.
The test statistic for this hypothesis test is.
(Round to two decimal places as needed.)
Expert Solution
This question has been solved!
Explore an expertly crafted, step-by-step solution for a thorough understanding of key concepts.

Includes step-by-step video

Learn your way
Includes step-by-step video

Step by step
Solved in 2 steps with 2 images

Recommended textbooks for you
College Algebra (MindTap Course List)
Algebra
ISBN:
9781305652231
Author:
R. David Gustafson, Jeff Hughes
Publisher:
Cengage Learning
College Algebra (MindTap Course List)
Algebra
ISBN:
9781305652231
Author:
R. David Gustafson, Jeff Hughes
Publisher:
Cengage Learning