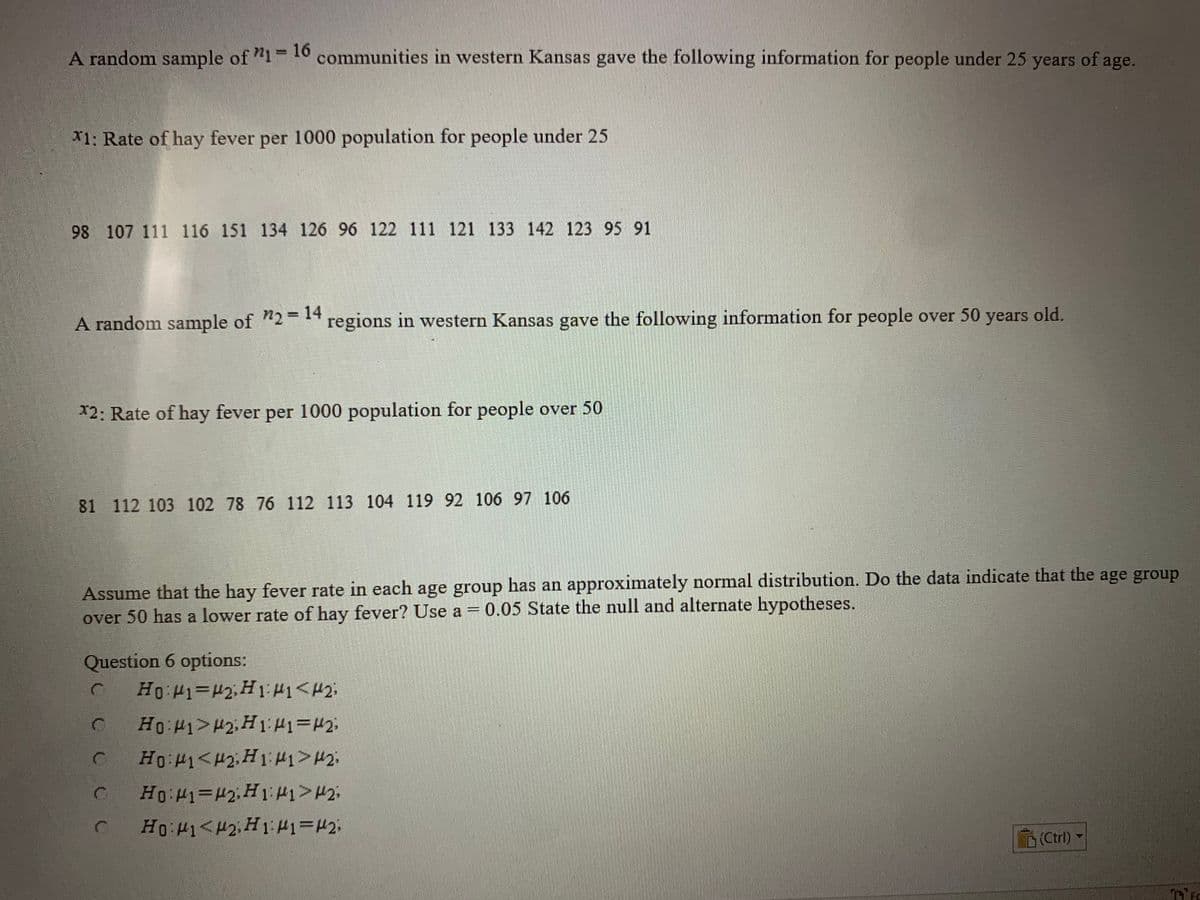
A random sample of "1= 10 communities in western Kansas gave the following information for people under 25 years of age. X1: Rate of hay fever per 1000 population for people under 25 98 107 111 116 151 134 126 96 122 111 121 133 142 123 95 91 A random sample of "2= 14 regions in western Kansas gave the following information for people over 50 years old.


Addition Rule of Probability
It simply refers to the likelihood of an event taking place whenever the occurrence of an event is uncertain. The probability of a single event can be calculated by dividing the number of successful trials of that event by the total number of trials.
Expected Value
When a large number of trials are performed for any random variable ‘X’, the predicted result is most likely the mean of all the outcomes for the random variable and it is known as expected value also known as expectation. The expected value, also known as the expectation, is denoted by: E(X).
Probability Distributions
Understanding probability is necessary to know the probability distributions. In statistics, probability is how the uncertainty of an event is measured. This event can be anything. The most common examples include tossing a coin, rolling a die, or choosing a card. Each of these events has multiple possibilities. Every such possibility is measured with the help of probability. To be more precise, the probability is used for calculating the occurrence of events that may or may not happen. Probability does not give sure results. Unless the probability of any event is 1, the different outcomes may or may not happen in real life, regardless of how less or how more their probability is.
Basic Probability
The simple definition of probability it is a chance of the occurrence of an event. It is defined in numerical form and the probability value is between 0 to 1. The probability value 0 indicates that there is no chance of that event occurring and the probability value 1 indicates that the event will occur. Sum of the probability value must be 1. The probability value is never a negative number. If it happens, then recheck the calculation.
The question is in the attachment
Given Information:
Under 25 years of age:
Sample size
Sample mean
Standard deviation
Over 50 years of age:
Sample size
Sample mean
Standard deviation
Significance level
State the hypothesis as follows:
Let denote the population mean of hay fever for age group under 25 years of age and denote the population mean of hay fever for age group over 50 years of age.
Null Hypothesis
Alternative Hypothesis i.e., age group over 50 has a lower rate of hay fever than age group under 25 years age. In other words, age group under 25 years of age has a higher rate of hay fever than age group over 50 years age.

Trending now
This is a popular solution!

Step by step
Solved in 2 steps


