A realtor is displaying the histogram below, which summarizes the percentage appreciation in value (over the past five years) for eadch of a random sample of 25 houses in Newburg Park. Relative frequency 04 0.32 02 02 02 .16 0.12 0.- 10 20 Appreciation (in percent) 30 40 Based on the histogram, draw the grve (the cumulative relative frequency palygon) for the sample data. Cumulative relative frequency 0.6 0.4 0.2 0.00 0.00 0.00 10 20 30 40 50 Appreciation (in percent)
A realtor is displaying the histogram below, which summarizes the percentage appreciation in value (over the past five years) for eadch of a random sample of 25 houses in Newburg Park. Relative frequency 04 0.32 02 02 02 .16 0.12 0.- 10 20 Appreciation (in percent) 30 40 Based on the histogram, draw the grve (the cumulative relative frequency palygon) for the sample data. Cumulative relative frequency 0.6 0.4 0.2 0.00 0.00 0.00 10 20 30 40 50 Appreciation (in percent)

Glencoe Algebra 1, Student Edition, 9780079039897, 0079039898, 2018
18th Edition
ISBN:9780079039897
Author:Carter
Publisher:Carter
Chapter10: Statistics
Section10.1: Measures Of Center
Problem 4GP

Related questions
Question
100%
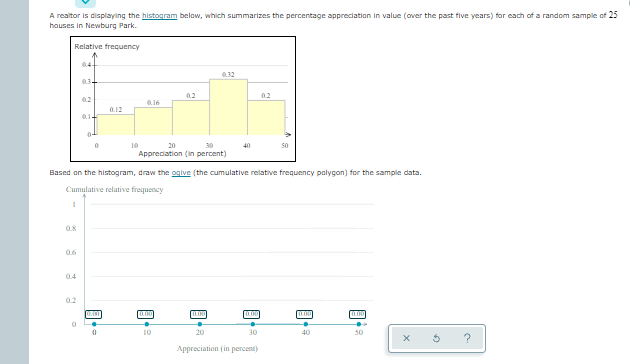
Transcribed Image Text:A realtor is displaying the histogram below, which summarizes the percentage appreciation in value (over the past five years) for each of a random sample of 25
houses in Newburg Park.
Relative frequency
0.4
0.32
03-
0.2
0.2
0.2
016
0.12
0.1
10
20
40
Appreciation (in percent)
Based on the histogram, draw the ogive (the ccumulative relative frequency polygon) for the sample data.
Cumulative relative froquency
0.6
0.4
02
0.00
0.00
[0.00
T0.00
0.0
10
20
30
40
30
Appreciation (in percent)
Expert Solution
This question has been solved!
Explore an expertly crafted, step-by-step solution for a thorough understanding of key concepts.

This is a popular solution!

Trending now
This is a popular solution!

Step by step
Solved in 2 steps with 1 images

Recommended textbooks for you
Glencoe Algebra 1, Student Edition, 9780079039897…
Algebra
ISBN:
9780079039897
Author:
Carter
Publisher:
McGraw Hill
Glencoe Algebra 1, Student Edition, 9780079039897…
Algebra
ISBN:
9780079039897
Author:
Carter
Publisher:
McGraw Hill