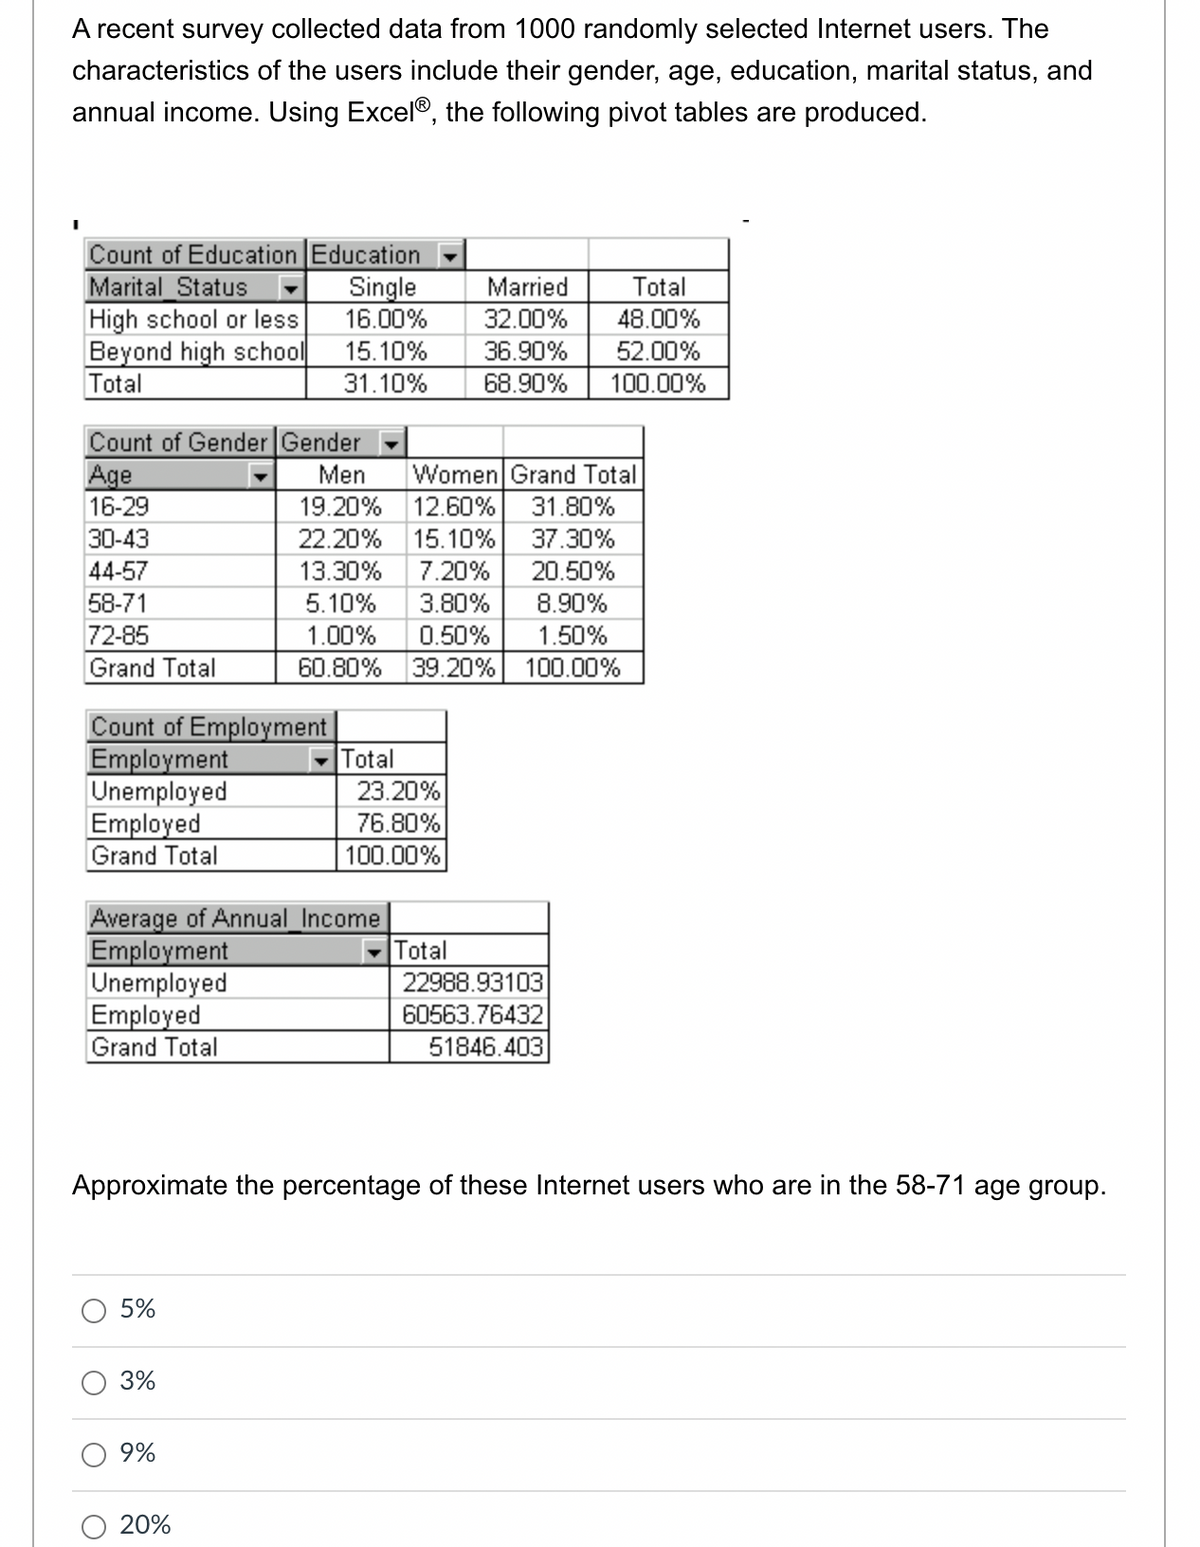
A recent survey collected data from 1000 randomly selected Internet users. The characteristics of the users include their gender, age, education, marital status, and annual income. Using Excel®, the following pivot tables are produced.
Q: Describe the skew of this Box-and-Whisker Plot. QI Q2 Q3 10 O Negatively Skewed O Positively Skewed…
A: When the median is closer to the top of the box, and if the whisker is shorter on the upper end of…
Q: Write aims of data classification ?
A: The Aims of data classification is as follows 1. It represents data concisely. 2. It helps to know…
Q: A study of crowd-funded projects showed that overall a majority were successful, that is, raised at…
A: As given here...........we have to construct a Simple Contingency table..... ******* Note that…
Q: Explain what is meant by the variable selection problem.
A: The problem of variable selection is generally referred as the problem of subset selection. It…
Q: For XYZ bank., one of the items to monitors is the credit balance of credit cards. One possible…
A: Given: The number of customers in each type of credit cards or the number of rows is r=41. The type…
Q: What is the effect size?
A: x y 8 5 9 9 5 2 sum = 22 sum =16 mean1=7.34 mean2=5.34 std1 = 1.69 std 2=…
Q: An auto parts store operated 3549 stores in 2004. By 2007, the auto parts store operated 4140…
A: Let y be the number of stores in year x let linear relation between x and y be y=ax+b Then…
Q: Use Excel to find the five-number summary for the Presidential Height Data. On your worksheet,…
A: Given, PRESIDENT HEIGHT Washington 188 J. Adams 170 Jefferson 189 Madison 163 Monroe…
Q: Identify the independent and dependent variables in the following scenarios. Explain each choice.
A:
Q: Find the transition points. y = 2x6 =18x4
A:
Q: College Rankings U.S. News & World Report periodically provides its rankings of national…
A: In this case, we need to determine the appropriate level of measurement of given data .
Q: (B) What are the conditions to reach (row-echelon form)?
A: Given :- What are the conditions to reach (row-echelon form)?
Q: A study of crowd-funded projects showed that overall a majority were successful, that is, raised at…
A: Introduction: It is required to obtain the row percentages and column percentages for the…
Q: Find the transition points. y = 8x³ + 192x²
A: Transition points are those points where f'(x) or f"(x) becomes zero.
Q: Explain Linear Systems?
A:
Q: Examine the scatter diagram and determine whether the type of relation is linear or nonlinear.
A: Solution is in the next step. Given:
Q: In model fitting, the variable that is being predicted is the A. usual x B. intervening variable C.…
A: An intervening variable is used to define or elaborate the causation between other variables.
Q: Find the best straight line fit to the given data points: (-3, 7); (1, -1); and (3, -7)
A:
Q: hat is the dependent variable, constant, independent variable, and control group? Do bigger dogs…
A: A scientific experiment consists of a set of steps designed to test a hypothesis. To correctly…
Q: Construct a boxplot for the data.
A: Here given 14 data First arrange data in ascending order
Q: Use a pivot table to construct a frequency distribution and histogram of lunch sales amounts for the…
A: Date Day Lunch Dinner Delivery 01-Apr Saturday 595 1406 911 02-Apr Sunday 938 1270 526 04-Apr…
Q: What is data?
A: Data is raw and unorganized fact which is required to be processed to draw meaningful conclusions.…
Q: What is meant by strategic mapping, and why is this technique especially useful in healthcare…
A: A strategic mapping is a simple graphic that shows a logical, cause-and-effect connection between…
Q: The Coca-Cola Company had sales of $35,123 million in 2010 and $45,998 million in 2014. Use the…
A:
Q: The data set hemorrhage.sav contains a sample of 100 low birth weight infants born in Boston,…
A: 1. The task is to test the association between the variables. Ho : β0=β1=β2=β3H1 : At least two of…
Q: What does The “Objective Coefficient” column provide?
A: Let OC denote Objective Coefficient.
Q: A study of crowd-funded projects showed that overall a majority were successful, that is, raised at…
A: Given: Category Successful Not Successful Total Film & Video 15044 20504 35548 Games…
Q: The Current Results website lists the average annual high and low temperatures (degreesfahrenheit)…
A:
Q: I want to explain these tables and output
A: Understanding the Tables: The table represents the number of valid observations taken into analysis…
Q: are defined as the effect of an independent variable on the dependent variable within a factorial…
A: Given : are defined as the effect of an independent variable on the dependent variable within a…
Q: A salesperson purchased an automobile that was advertised as averaging 27 miles/gallon in the city…
A: Averaging in city = 27 miles per gallon. averaging on highway = 38 miles/gallon…
Q: Find a natural cubic spline interpolating the data (-1, 13), (0,7), (1,9)
A: Writing data in table format x -1 0 1 y 13 7 9 Formula for natural cubic spline is:…
Q: On a cold day in Minneapolis, the afternoon temperature was 48 degrees before a cold front moved…
A: The domain of a data set is the set of values that the data set contains. The values in the domain…
Q: In a strip-split plot design in CRD, which factor has the highest precision? A. main plot B. subplot…
A: We have given the following statement about the design of experiment.
Q: What is the linear pattern of 4500 students in 2014 and 3700 students in 2019
A: The linear pattern is: Since, the no. of students are decreasing from the year 2014…
Q: A study compared men who viewed high levels of television violence as children with those who did…
A: a. The row totals can be obtained by taking the sum of the observations of rows and the column…
Q: Which one of the two-way tables below conveys the same information?
A:
Q: A researcher plans to do a study to see whether people who eat an all carbohydrate diet have…
A: Introduction: The variable in a study that potentially changes in response to changes in one or more…
Q: Write the aims of data classification
A: Data classification: Data classification is the method of unifying data into groups for its most…
Q: To balance inventory at Otto's Optometry, customer Gender and Eye Condition were collected in the…
A: Customer # Eye Condition Gender 1 Farsighted Male 2 Bifocals Male 3 Nearsighted Male 4…
Q: What is the simple spending multiplier
A:
Q: I finished first in the high jump and third in the pole vault. determine whether the data described…
A: Nominal Data- Take more than 2 values but these values are not ordered –there is no natural ordering…
Q: What is co-ordinated system?
A: We have to define co-ordinated system. Co-ordinated system is system in geometry in which we…
Q: Determine the best (according to sum-of-squares-measure) curve y = ax2, through the data above.
A: Determine the best curve y = ax2 through the data : Now, y = ax2∑y = ∑ax2 = a…
Q: Construct an ogive for the data.
A:
Q: Consider the data (1.3). (2.5). (3
A: Given the data 1, 3, 2, 5, and 3, 9.67
Q: The boxplots show data for state and local community expenditures on hospitals and highways.…
A: Interpretation for box plots: - The center line inside the box is for the median of the data which…
Q: What is the cost of each plan if 8 GBS of data are used in one month? Plan 1: y = 75 Plan 2: y = 20…
A:
Trending now
This is a popular solution!
Step by step
Solved in 2 steps
- What social media tools do marketers commonly use? The “2015 Social Media Marketing Industry Report” by Social Media Examiner (socialmediaexaminer.com) surveyed marketers who commonly use an indicated social media tool. Surveyed marketers who commonly use an indicated social media tool. Surveyed were both B2B marketers, marketers that primarily target consumers. Suppose the survey was based on 500B2B marketers and 500 B2C marketers and yielded the results in the following table below: SOCIAL MEDIA TOOL BUSINESS FOCUS (B2B) (%) BUSINESS FOCUS (B2C) (%) FACEBOOK 88 96 TWITTER 83 77 For each social media tool, at the 0.05 level of significance, determine whether there is a difference between B2B marketers and B2C marketers in the proportion who used each social media tool. State the complete hypotheses (hypothesis null and hypothesis alternative for question (a) aboveUse PivotTables to construct cross-tabulations between each pair of variables for the data provided. soda preference data. Gender Favorite Brand Consumption TimeMale Dr Pepper AfternoonFemale Sunkist MorningMale Coke AfternoonFemale Other AfternoonFemale Coke NightFemale A&W Root Beer AfternoonMale Mountain Dew AfternoonFemale A&W Root Beer EveningMale Other NightMale Mountain Dew AfternoonFemale Pepsi AfternoonFemale Other AfternoonMale Coke NightFemale 7UP MorningFemale Coke Night Complete the cross-tabulation for Favorite Brand vs. Consumption Time. (Type whole numbers.) Favorite Brand vs Consumption Time Count of Consumption Time Column Labels Row Labels Afternoon Evening Morning Night Grand Total 7UP enter your response here enter your response here enter your response here enter your response here enter your response…The human papillomavirus associated with the development of cervical cancer, genital warts, and some less common cancers. John Hopkins conducted a study to investigate the characteristics of female patients who came to their clinics between 2006 and 2008 to begin the three-shot regimen of vaccinations with the anti-human papillomavirus (HPV) medication Gardasil. A contingency table summarizing the vaccine completions by race for 1222 patients is provided below. 1.State the null and alternative hypotheses. 2.Compute the test statistic. Compute the test statistic. Document how the expected counts and the value of the test statistic are computed and enter them into the table and input box provided. Round the expected counts to 3 decimal places and the test statistic to 2 decimal places. 3.Compute the p-value. Provide the name of the distribution and the parameters used to compute the p-value. Then enter your anwer rounded to 4 decimal places. 4.Interpret the results of the significance…
- All of the following are common strategies in qualitative data analysis except: a. use of tests of significance b. use of hierarchies c. use of typologies d. use of networksThe U.S. Department of Energy’s Fuel Economy Guide provides fuel efficiency datafor cars and trucks (Fuel Economy website, September, 2012). A portion of the data for149 compact, midsize, and large cars is shown in Table 2.13. The data set contains thefollowing variables:Size: Compact, Midsize, and LargeDisplacement: Engine size in litersCylinders: Number of cylinders in the engineDrive: All wheel (A), front wheel (F), and rear wheel (R)Fuel Type: Premium (P) or regular (R) fuelCity MPG: Fuel efficiency rating for city driving in terms of miles per gallonHwy MPG: Fuel efficiency rating for highway driving in terms of miles per gallonThe complete data set is contained in the file named FuelData2012.a. Prepare a crosstabulation of the data on Size (rows) and Hwy MPG (columns). Useclasses of 15–19, 20–24, 25–29, 30–34, 35–39, and 40–44 for Hwy MPG.b. Comment on the relationship beween Size and Hwy MPG.The U.S. Department of Energy’s Fuel Economy Guide provides fuel efficiency datafor cars and trucks (Fuel Economy website, September, 2012). A portion of the data for149 compact, midsize, and large cars is shown in Table 2.13. The data set contains thefollowing variables:Size: Compact, Midsize, and LargeDisplacement: Engine size in litersCylinders: Number of cylinders in the engineDrive: All wheel (A), front wheel (F), and rear wheel (R)Fuel Type: Premium (P) or regular (R) fuelCity MPG: Fuel efficiency rating for city driving in terms of miles per gallonHwy MPG: Fuel efficiency rating for highway driving in terms of miles per gallonThe complete data set is contained in the file named FuelData2012.a. Prepare a crosstabulation of the data on Size (rows) and Hwy MPG (columns). Useclasses of 15–19, 20–24, 25–29, 30–34, 35–39, and 40–44 for Hwy MPG.b. Comment on the relationship beween Size and Hwy MPG.c. Prepare a crosstabulation of the data on Drive (rows) and City MPG (columns).…
- Cincinnati Paint Company sells quality brands of paints through hardware stores throughout the United States. The company maintains a large sales force who call on existing customers and look for new business. The national sales manager is investigating the relationship between the number of sales calls made and the miles driven by the sales representative. Also, do the sales representatives who drive the most miles and make the most calls necessarily earn the most in sales commissions? To investigate, the vice president of sales selected a sample of 25 sales representatives and determined: The amount earned in commissions last month (y) The number of miles driven last month (x1) The number of sales calls made last month (x2) The information is reported below. Commissions ($000) Calls Driven Commissions ($000) Calls Driven 23 68 2,372 39 188 3,291 14 30 2,229 44 218 3,103 34 136 2,733 29 105 2,123 39 180 3,353 38 162 2,794 24 77 2,291 37 154 3,209 47 186 3,451 15 25…Cincinnati Paint Company sells quality brands of paints through hardware stores throughout the United States. The company maintains a large sales force who call on existing customers and look for new business. The national sales manager is investigating the relationship between the number of sales calls made and the miles driven by the sales representative. Also, do the sales representatives who drive the most miles and make the most calls necessarily earn the most in sales commissions? To investigate, the vice president of sales selected a sample of 25 sales representatives and determined: The amount earned in commissions last month (y) The number of miles driven last month (x1) The number of sales calls made last month (x2) The information is reported below. Commissions ($000) Calls Driven Commissions ($000) Calls Driven 22 143 2,375 38 150 3,291 13 132 2,228 45 145 3,103 33 148 2,735 29 147 2,122 39 146 3,354 38 146 2,795 24 142 2,291 38 153 3,213 48 142 3,449…The "Popular Kids" dataset also divided the students' responses into "Urban," "Suburban," and "Rural" schoolareas. Is there an association between the type of school area and the students' choice of good grades, athleticability, or popularity as most important? A two-way table for student goals and school area appears as follows:
- Organizations such as J.D. Power and Associates use the proportion of owners likely to repurchase a particular automobile as an indication of customer loyalty for the automobile. An automobile with a greater proportion of owners likely to repurchase is concluded to have greater customer loyalty. A study was conducted to compare the customer loyalty for three automobiles: Chevrolet Impala, Ford Fusion, and Honda Accord. The study contained 500 respondents and the data is summarized in the Microsoft Excel Online file below. Use the spreadsheet to perform the required calculations and hypothesis test.In the dataset, the variable "diet_new" is a dichotomous variable, 0 = plant-based diet group, and 1 = non-plant-based diet group; and the variable "exercise" indicates the average exercise time per day.What percentage of customers in the sample prefer Action movies ? Complete the frequency table based on the Pivot table information MovieGenre Female Male Total Action Comedy Drama SciFi Total INSERT PIVOT TABLE HERE Sum of DollarAmt ($) Column Labels Row Labels Female Male Grand Total Action 2361 1715 4076 Comedy 1614 95 1709 Drama 4399 6403 10802 SciFi 5133 2636 7769 Grand Total 13507 10849 24356