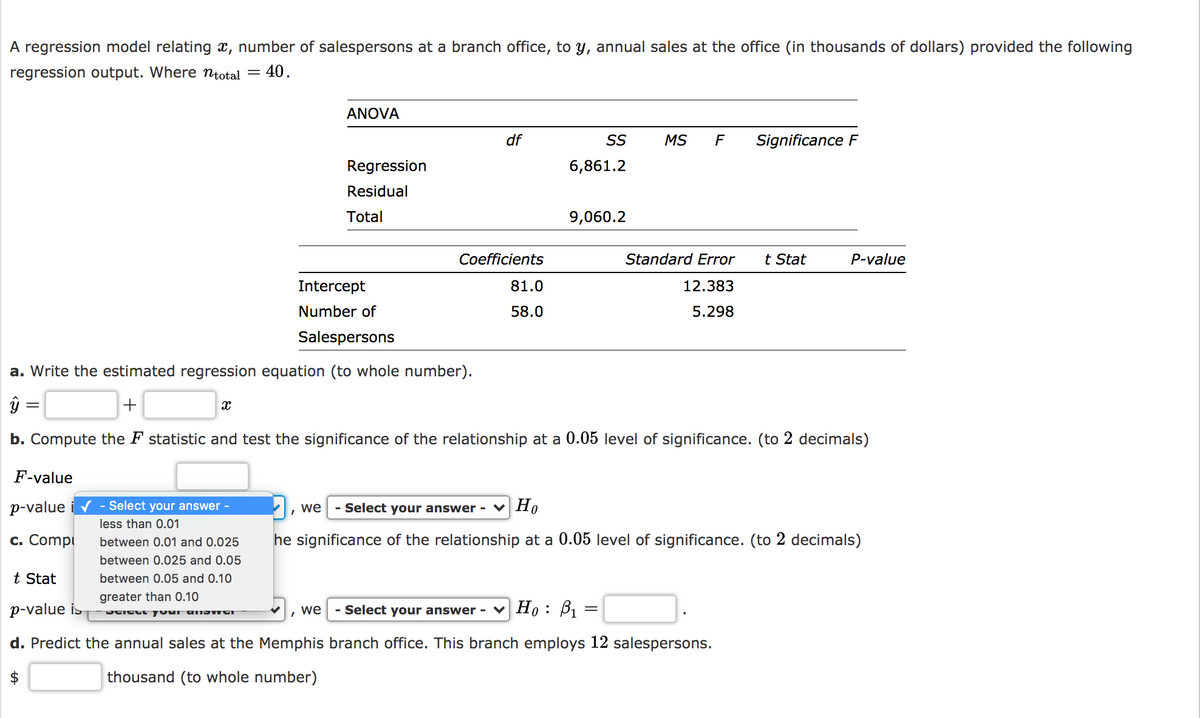
A regression model relating x, number of salespersons at a branch office, to y, annual sales at the office (in thousands of dollars) provided the following regression output. Where ntotal = 40. ANOVA df SS MS F Significance F Regression 6,861.2 Residual Total 9,060.2 Coefficients Standard Error t Stat P-value Intercept 81.0 12.383 Number of 58.0 5.298 Salespersons a. Write the estimated regression equation (to whole number). b. Compute the F statistic and test the significance of the relationship at a 0.05 level of significance. (to 2 decimals) F-value p-value - Select your answer - , we Select your answer- Но less than 0.01 с. Compi between 0.01 and 0.025 he significance of the relationship at a 0.05 level of significance. (to 2 decimals) between 0.025 and 0.05 t Stat between 0.05 and 0.10 greater than 0.10 p-value Is ereue yuur unawer - Select your answer - v Ho: B, , we d. Predict the annual sales at the Memphis branch office. This branch employs 12 salespersons. 2$ thousand (to whole number)


Correlation
Correlation defines a relationship between two independent variables. It tells the degree to which variables move in relation to each other. When two sets of data are related to each other, there is a correlation between them.
Linear Correlation
A correlation is used to determine the relationships between numerical and categorical variables. In other words, it is an indicator of how things are connected to one another. The correlation analysis is the study of how variables are related.
Regression Analysis
Regression analysis is a statistical method in which it estimates the relationship between a dependent variable and one or more independent variable. In simple terms dependent variable is called as outcome variable and independent variable is called as predictors. Regression analysis is one of the methods to find the trends in data. The independent variable used in Regression analysis is named Predictor variable. It offers data of an associated dependent variable regarding a particular outcome.


Trending now
This is a popular solution!

Step by step
Solved in 2 steps with 1 images


