A restaurant chain has two locations in a medium-sized town and, believing that it has oversaturated the market for its food, is considering closing one of the restaurants. The manager of the restaurant with a downtown location daims that his restaurant generates more revenue than the sister restaurant by the freeway. The CEO of this company, wishing to test this daim, randomly selects 36 monthly revenue totals for each restaurant. The revenue data from the downtown restaurant have a mean of $360,000 and a standard deviation of $50,000, while the data from the restaurant by the freeway have a mean of $340,000 and a standard deviation of $40,000. Assume there is no reason to believe the population standard deviations are equal and let h and h denote the mean monthly revenue of the downtown restaurant and the restaurant by the freeway, respectively. Which of the following is the correct value of the test statistic to analyze the daim?. A. t66 = 1.848 B. ts7 = 1.848 C. ts6 = 1.874 D. ts7 1.874
A restaurant chain has two locations in a medium-sized town and, believing that it has oversaturated the market for its food, is considering closing one of the restaurants. The manager of the restaurant with a downtown location daims that his restaurant generates more revenue than the sister restaurant by the freeway. The CEO of this company, wishing to test this daim, randomly selects 36 monthly revenue totals for each restaurant. The revenue data from the downtown restaurant have a mean of $360,000 and a standard deviation of $50,000, while the data from the restaurant by the freeway have a mean of $340,000 and a standard deviation of $40,000. Assume there is no reason to believe the population standard deviations are equal and let h and h denote the mean monthly revenue of the downtown restaurant and the restaurant by the freeway, respectively. Which of the following is the correct value of the test statistic to analyze the daim?. A. t66 = 1.848 B. ts7 = 1.848 C. ts6 = 1.874 D. ts7 1.874

Chapter8: Sequences, Series,and Probability
Section8.6: Counting Principles
Problem 74E: Lottery Powerball is a lottery game that is operated by the Multi-State Lottery Association and is...

Related questions

Question
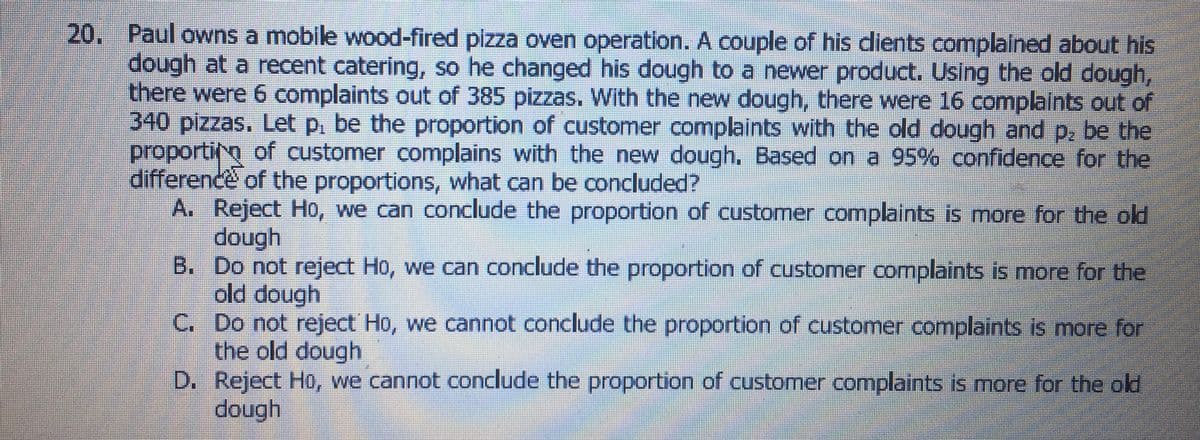
Transcribed Image Text:20. Paul owns a mobile wood-fired pizza oven operation. A couple of his dients complained about his
dough at a recent catering, so he changed his dough to a newer product. Using the old dough,
there were 6 complaints out of 385 pizzas. With the new dough, there were 16 complalnts out of
340pizzas. Let p, be the proportion of customer complaints with the old dough and p, be the
proporti(n of customer complains with the new dough, Based on a 95% confidence for the
difference of the proportions, what can be concluded?
A. Reject Ho, we can conclude the proportion of customer complaints is more for the old
dough
B. Do not reject Ho, we can conclude the proportion of customer complaints is more for the
old dough
C. Do not reject Ho, we cannot conclude the proportion of customer complaints is more for
the old dough
D. Reject Ho, we cannot conclude the proportion of customer complaints is more for the old
dough
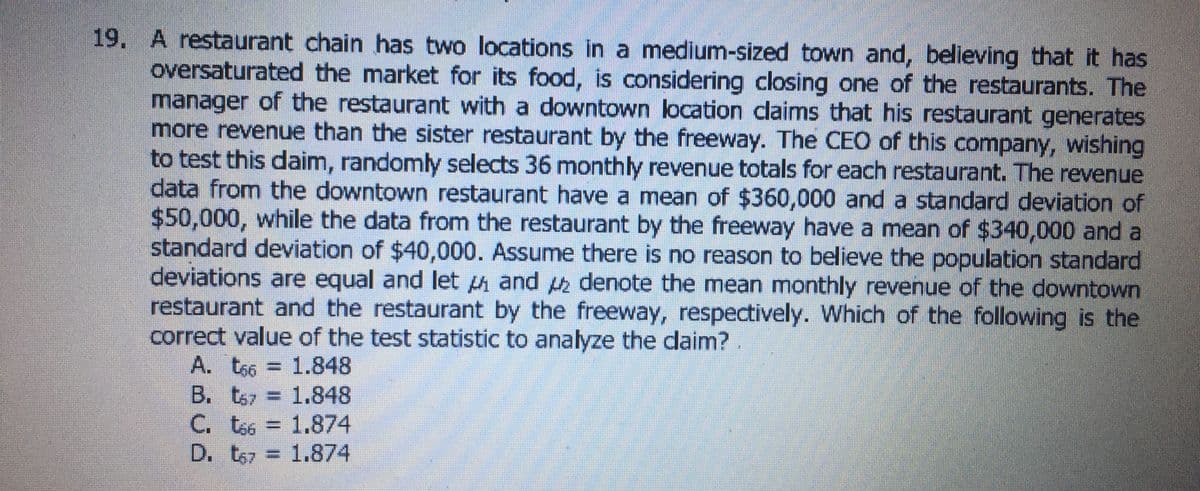
Transcribed Image Text:19. A restaurant chain has two locations in a medium-sized town and, believing that it has
oversaturated the market for its food, is considering closing one of the restaurants. The
manager of the restaurant with a downtown location cdaims that his restaurant generates
more revenue than the sister restaurant by the freeway. The CEO of this company, wishing
to test this daim, randomly selects 36 monthly revenue totals for each restaurant. The revenue
data from the downtown restaurant have a mean of $360,000 and a standard deviation of
$50,000, while the data from the restaurant by the freeway have a mean of $340,000 and a
standard deviation of $40,000. Assume there is no reason to believe the population standard
deviations are equal and let u and denote the mean monthly revenue of the downtown
restaurant and the restaurant by the freeway, respectively. Which of the following is the
correct value of the test statistic to analyze the daim?
A. ts6
1.848
B. t = 1.848
C. t = 1.874
D. t67
1.874
Expert Solution
This question has been solved!
Explore an expertly crafted, step-by-step solution for a thorough understanding of key concepts.

This is a popular solution!

Trending now
This is a popular solution!

Step by step
Solved in 2 steps with 2 images

Knowledge Booster


Learn more about
Need a deep-dive on the concept behind this application? Look no further. Learn more about this topic, statistics and related others by exploring similar questions and additional content below.Recommended textbooks for you

Algebra & Trigonometry with Analytic Geometry
Algebra
ISBN:
9781133382119
Author:
Swokowski
Publisher:
Cengage
Algebra & Trigonometry with Analytic Geometry
Algebra
ISBN:
9781133382119
Author:
Swokowski
Publisher:
Cengage