A school administrator wants to see if there is a difference in the number of students per class for Portland Public School district (group 1) compared to the Beaverton School district (group 2). Assume the populations are normally distributed with unequal variances. A random sample of 28 Portland classes found a mean of 34 students per class with a standard deviation of 2. A random sample of 26 Beaverton classes found a mean of 37 students per class with a standard deviation of 4. Find a 90% confidence interval in the difference of the means. Use technology to find the critical value using df = 36.1505 and round answers to 4 decimal places.
A school administrator wants to see if there is a difference in the number of students per class for Portland Public School district (group 1) compared to the Beaverton School district (group 2). Assume the populations are normally distributed with unequal variances. A random sample of 28 Portland classes found a mean of 34 students per class with a standard deviation of 2. A random sample of 26 Beaverton classes found a mean of 37 students per class with a standard deviation of 4. Find a 90% confidence interval in the difference of the means. Use technology to find the critical value using df = 36.1505 and round answers to 4 decimal places.

MATLAB: An Introduction with Applications
6th Edition
ISBN:9781119256830
Author:Amos Gilat
Publisher:Amos Gilat
Chapter1: Starting With Matlab
Section: Chapter Questions
Problem 1P

Related questions
Question
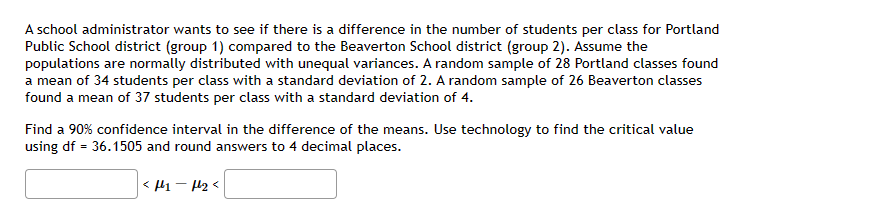
Transcribed Image Text:A school administrator wants to see if there is a difference in the number of students per class for Portland
Public School district (group 1) compared to the Beaverton School district (group 2). Assume the
populations are normally distributed with unequal variances. A random sample of 28 Portland classes found
a mean of 34 students per class with a standard deviation of 2. A random sample of 26 Beaverton classes
found a mean of 37 students per class with a standard deviation of 4.
Find a 90% confidence interval in the difference of the means. Use technology to find the critical value
using df = 36.1505 and round answers to 4 decimal places.
<f1-f₂<
Expert Solution
This question has been solved!
Explore an expertly crafted, step-by-step solution for a thorough understanding of key concepts.

Step by step
Solved in 3 steps with 3 images

Recommended textbooks for you
MATLAB: An Introduction with Applications
Statistics
ISBN:
9781119256830
Author:
Amos Gilat
Publisher:
John Wiley & Sons Inc

Probability and Statistics for Engineering and th…
Statistics
ISBN:
9781305251809
Author:
Jay L. Devore
Publisher:
Cengage Learning

Statistics for The Behavioral Sciences (MindTap C…
Statistics
ISBN:
9781305504912
Author:
Frederick J Gravetter, Larry B. Wallnau
Publisher:
Cengage Learning
MATLAB: An Introduction with Applications
Statistics
ISBN:
9781119256830
Author:
Amos Gilat
Publisher:
John Wiley & Sons Inc
Probability and Statistics for Engineering and th…
Statistics
ISBN:
9781305251809
Author:
Jay L. Devore
Publisher:
Cengage Learning
Statistics for The Behavioral Sciences (MindTap C…
Statistics
ISBN:
9781305504912
Author:
Frederick J Gravetter, Larry B. Wallnau
Publisher:
Cengage Learning

Elementary Statistics: Picturing the World (7th E…
Statistics
ISBN:
9780134683416
Author:
Ron Larson, Betsy Farber
Publisher:
PEARSON

The Basic Practice of Statistics
Statistics
ISBN:
9781319042578
Author:
David S. Moore, William I. Notz, Michael A. Fligner
Publisher:
W. H. Freeman

Introduction to the Practice of Statistics
Statistics
ISBN:
9781319013387
Author:
David S. Moore, George P. McCabe, Bruce A. Craig
Publisher:
W. H. Freeman