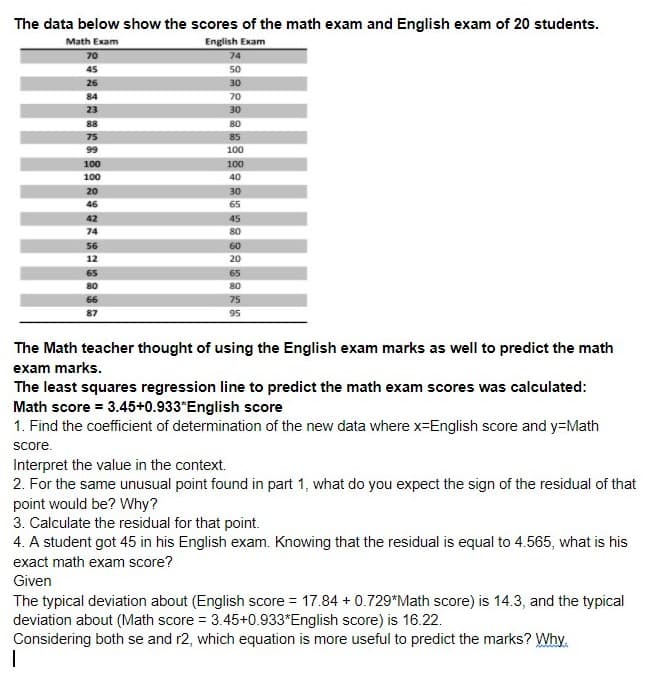
The data below show the scores of the math exam and English exam of 20 students. Math Exam English Exam 70 74 45 50 26 30 84 70 23 30 88 80 75 85 99 100 100 100 100 40 20 30 46 65 42 45 74 80 56 60 12 20 65 65 80 80 66 75 87 95 The Math teacher thought of using the English exam marks as well to predict the math exam marks. The least squares regression line to predict the math exam scores was calculated: Math score = 3.45+0.933*English score 1. Find the coefficient of determination of the new data where x-English score and y=Math score. Interpret the value in the context. 2. For the same unusual point found in part 1, what do you expect the sign of the residual of that point would be? Why? 3. Calculate the residual for that point.


Correlation
Correlation defines a relationship between two independent variables. It tells the degree to which variables move in relation to each other. When two sets of data are related to each other, there is a correlation between them.
Linear Correlation
A correlation is used to determine the relationships between numerical and categorical variables. In other words, it is an indicator of how things are connected to one another. The correlation analysis is the study of how variables are related.
Regression Analysis
Regression analysis is a statistical method in which it estimates the relationship between a dependent variable and one or more independent variable. In simple terms dependent variable is called as outcome variable and independent variable is called as predictors. Regression analysis is one of the methods to find the trends in data. The independent variable used in Regression analysis is named Predictor variable. It offers data of an associated dependent variable regarding a particular outcome.


Trending now
This is a popular solution!

Step by step
Solved in 3 steps


