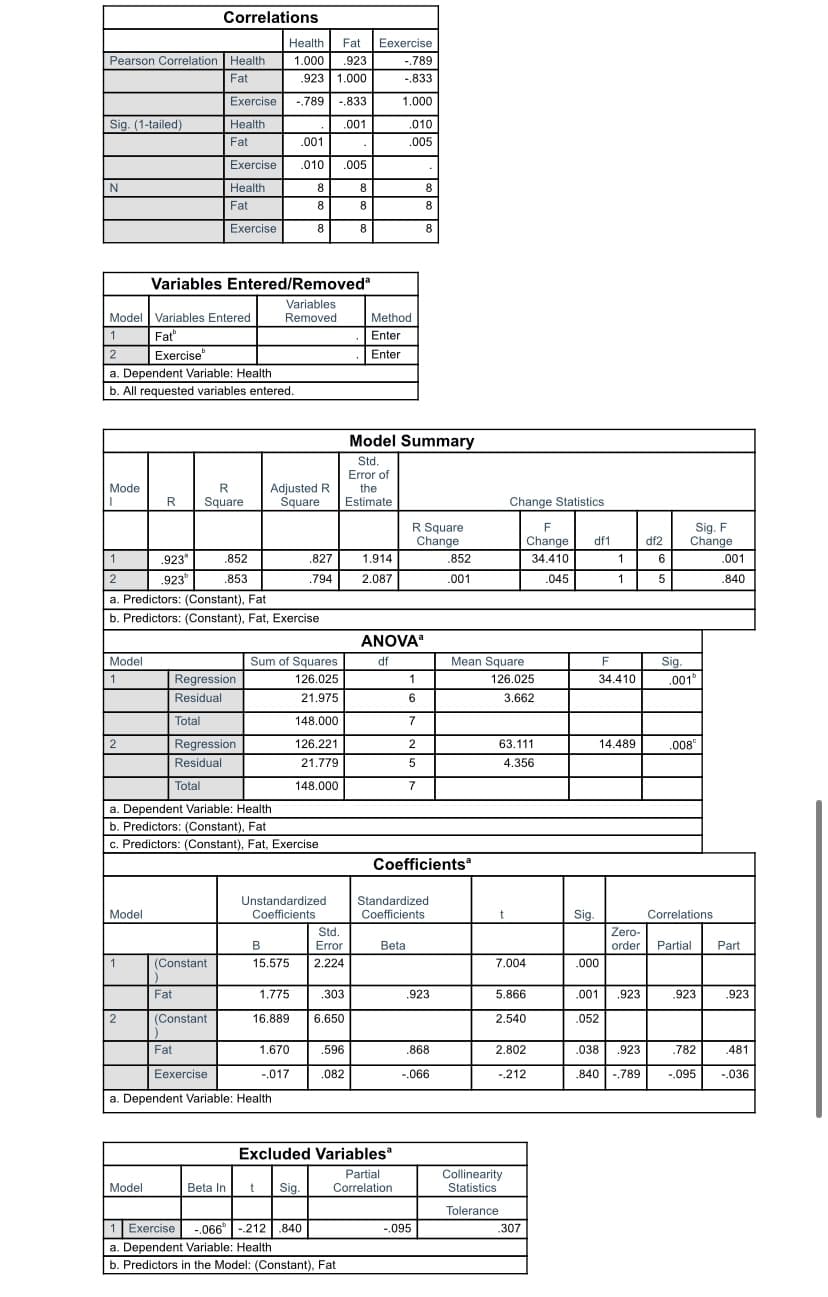
A sport psychologist wanted to test the extent to which daily intake of fat in grams, and amount of exercise (in minutes) can predict health m=(measured using a Body mass index {BMI} scale in which higher scores indicate poorer health. Using the da1ta below: Fat (grams)​​ . Exercise (minutes).    ​Health (BMI) 8​.                    ​​34​​.                               ​32 11​​.                    ​10​.                               ​​34 5​​.                     ​50​​​.                               23 9​​​.                     15​​​.                               33 8​.                     ​​35​​​.                               28 5​​​.                     40​.                               ​​27 6​​​.                     20​​.                               ​25 4 ​​​.                    60​​.                               ​22   -the psychologist concluded exercise did not provide any additional information because a.) R2 = .923 b.) Adjusted R2 =.853 c.) B= -.017 d.) F change = .045; p>.05   -The linear equation resulting from this is (hint: let SPSS make the decision) a.) Ŷ= 1.670X1 + (-.017)X2 + 16.89 b.) Ŷ= (1.775)X1 + (1.670)X2 + 16.89 c.) Ŷ= .923X1 + (-.789)X2 + 16.89 d.) Ŷ= 16.89X1 + (-.017+1.670)X2   -Did doing exercise provide significantly to the health of the athletes?  Provide the regression statistics that show the effect of exercise beyond the effect of body fat.

Functions and Change: A Modeling Approach to College Algebra (MindTap Course List)
6th Edition
ISBN:9781337111348
Author:Bruce Crauder, Benny Evans, Alan Noell
Publisher:Bruce Crauder, Benny Evans, Alan Noell
Chapter5: A Survey Of Other Common Functions
Section5.6: Higher-degree Polynomials And Rational Functions
Problem 5E: Population Genetics In the study of population genetics, an important measure of inbreeding is the...
icon
Related questions
Question

A sport psychologist wanted to test the extent to which daily intake of fat in grams, and amount of exercise (in minutes) can predict health m=(measured using a Body mass index {BMI} scale in which higher scores indicate poorer health. Using the da1ta below:

Fat (grams)​​ . Exercise (minutes).    ​Health (BMI)

8​.                    ​​34​​.                               ​32

11​​.                    ​10​.                               ​​34

5​​.                     ​50​​​.                               23

9​​​.                     15​​​.                               33

8​.                     ​​35​​​.                               28

5​​​.                     40​.                               ​​27

6​​​.                     20​​.                               ​25

4 ​​​.                    60​​.                               ​22


-the psychologist concluded exercise did not provide any additional information because
a.) R2 = .923
b.) Adjusted R2 =.853
c.) B= -.017
d.) F change = .045; p>.05


-The linear equation resulting from this is (hint: let SPSS make the decision)
a.) Ŷ= 1.670X1 + (-.017)X2 + 16.89
b.) Ŷ= (1.775)X1 + (1.670)X2 + 16.89
c.) Ŷ= .923X1 + (-.789)X2 + 16.89
d.) Ŷ= 16.89X1 + (-.017+1.670)X2


-Did doing exercise provide significantly to the health of the athletes?  Provide the regression statistics that show the effect of exercise beyond the effect of body fat.
Correlations
Health
Fat
Eexercise
Pearson Correlation Health
1.000
923
-.789
Fat
.923 1.000
-.833
Exercise
-.789
-.833
1.000
Sig. (1-tailed)
Health
.001
.010
Fat
.001
.005
Exercise
.010
.005
Health
8
8
8.
Fat
8
8
8
Exercise
8
8
Variables Entered/Removed
Variables
Removed
Model Variables Entered
Fat
Exercise
a. Dependent Variable: Health
Method
1
Enter
2
Enter
b. All requested variables entered.
Model Summary
Std.
Error of
the
Estimate
Mode
R
Square
Adjusted R
Square
Change Statistics
R Square
Change
Sig. F
Change
F
Change
df1
df2
1
.923
.852
.827
1.914
.852
34.410
1
6
.001
2
.923"
.853
794
2.087
.001
.045
.840
a. Predictors: (Constant), Fat
b. Predictors: (Constant), Fat, Exercise
ANOVA
Sum of Squares
Mean Square
Sig.
.001
Model
df
F
1
Regression
126.025
1
126.025
34.410
Residual
21.975
3.662
Total
148.000
2
Regression
126.221
2
63.111
14.489
.008
Residual
21.779
5
4.356
Total
148.000
a. Dependent Variable: Health
b. Predictors: (Constant), Fat
c. Predictors: (Constant), Fat, Exercise
Coefficients
Standardized
Coefficients
Unstandardized
Model
Coefficients
Sig.
Correlations
Std.
Zero-
B
Error
Beta
order
Partial
Part
(Constant
15.575
2.224
7.004
.000
Fat
1.775
.303
.923
5.866
.001
.923
.923
.923
|(Constant
16.889
6.650
2.540
.052
Fat
1.670
.596
.868
2.802
.038
.923
.782
.481
Eexercise
-.017
.082
-.066
-.212
840
-.789
-.095
-.036
a. Dependent Variable: Health
Excluded Variables
Collinearity
Statistics
Partial
Model
Beta In
Sig.
Correlation
Tolerance
1 Exercise
a. Dependent Variable: Health
-.066°|-212 |.840
-.095
.307
b. Predictors in the Model: (Constant), Fat
Transcribed Image Text:Correlations Health Fat Eexercise Pearson Correlation Health 1.000 923 -.789 Fat .923 1.000 -.833 Exercise -.789 -.833 1.000 Sig. (1-tailed) Health .001 .010 Fat .001 .005 Exercise .010 .005 Health 8 8 8. Fat 8 8 8 Exercise 8 8 Variables Entered/Removed Variables Removed Model Variables Entered Fat Exercise a. Dependent Variable: Health Method 1 Enter 2 Enter b. All requested variables entered. Model Summary Std. Error of the Estimate Mode R Square Adjusted R Square Change Statistics R Square Change Sig. F Change F Change df1 df2 1 .923 .852 .827 1.914 .852 34.410 1 6 .001 2 .923" .853 794 2.087 .001 .045 .840 a. Predictors: (Constant), Fat b. Predictors: (Constant), Fat, Exercise ANOVA Sum of Squares Mean Square Sig. .001 Model df F 1 Regression 126.025 1 126.025 34.410 Residual 21.975 3.662 Total 148.000 2 Regression 126.221 2 63.111 14.489 .008 Residual 21.779 5 4.356 Total 148.000 a. Dependent Variable: Health b. Predictors: (Constant), Fat c. Predictors: (Constant), Fat, Exercise Coefficients Standardized Coefficients Unstandardized Model Coefficients Sig. Correlations Std. Zero- B Error Beta order Partial Part (Constant 15.575 2.224 7.004 .000 Fat 1.775 .303 .923 5.866 .001 .923 .923 .923 |(Constant 16.889 6.650 2.540 .052 Fat 1.670 .596 .868 2.802 .038 .923 .782 .481 Eexercise -.017 .082 -.066 -.212 840 -.789 -.095 -.036 a. Dependent Variable: Health Excluded Variables Collinearity Statistics Partial Model Beta In Sig. Correlation Tolerance 1 Exercise a. Dependent Variable: Health -.066°|-212 |.840 -.095 .307 b. Predictors in the Model: (Constant), Fat
Expert Solution
trending now

Trending now

This is a popular solution!

steps

Step by step

Solved in 5 steps

Blurred answer
Knowledge Booster
Types of Data and Their Measurement
Learn more about
Need a deep-dive on the concept behind this application? Look no further. Learn more about this topic, statistics and related others by exploring similar questions and additional content below.
Similar questions
Recommended textbooks for you
Functions and Change: A Modeling Approach to Coll…
Algebra
ISBN:
9781337111348
Author:
Bruce Crauder, Benny Evans, Alan Noell
Publisher:
Cengage Learning
Big Ideas Math A Bridge To Success Algebra 1: Stu…
Algebra
ISBN:
9781680331141
Author:
HOUGHTON MIFFLIN HARCOURT
Publisher:
Houghton Mifflin Harcourt