A state political analyst wanted to see whether there is an association between the region where a person lives and whether the person is in favor of increasing the state gas tax. A random sample of 270 state residents was selected, and the table below shows the results of the survey.
A state political analyst wanted to see whether there is an association between the region where a person lives and whether the person is in favor of increasing the state gas tax. A random sample of 270 state residents was selected, and the table below shows the results of the survey.

Holt Mcdougal Larson Pre-algebra: Student Edition 2012
1st Edition
ISBN:9780547587776
Author:HOLT MCDOUGAL
Publisher:HOLT MCDOUGAL
Chapter11: Data Analysis And Probability
Section11.5: Interpreting Data
Problem 1E

Related questions

Question
100%
Transcribed Image Text:legeboard.org/33/assessments/assignments/26942366
Gwallerbulldogs.net bookmarks
C waller isd hompage Statistics Formula.
AClasses
5 Macmillan: UPDAT.
Google Slides
Interpreting slope
Wednesday, Septe..
EGoogle Docs
'CollegeBoard
AP Classroom
Unit 8 Progress Check: MCQ Part B
Kaiden Robertson
3
4.
6.
8.
10
11
12)
(13)
(14)
(15)
( 11 c
Question 11 W
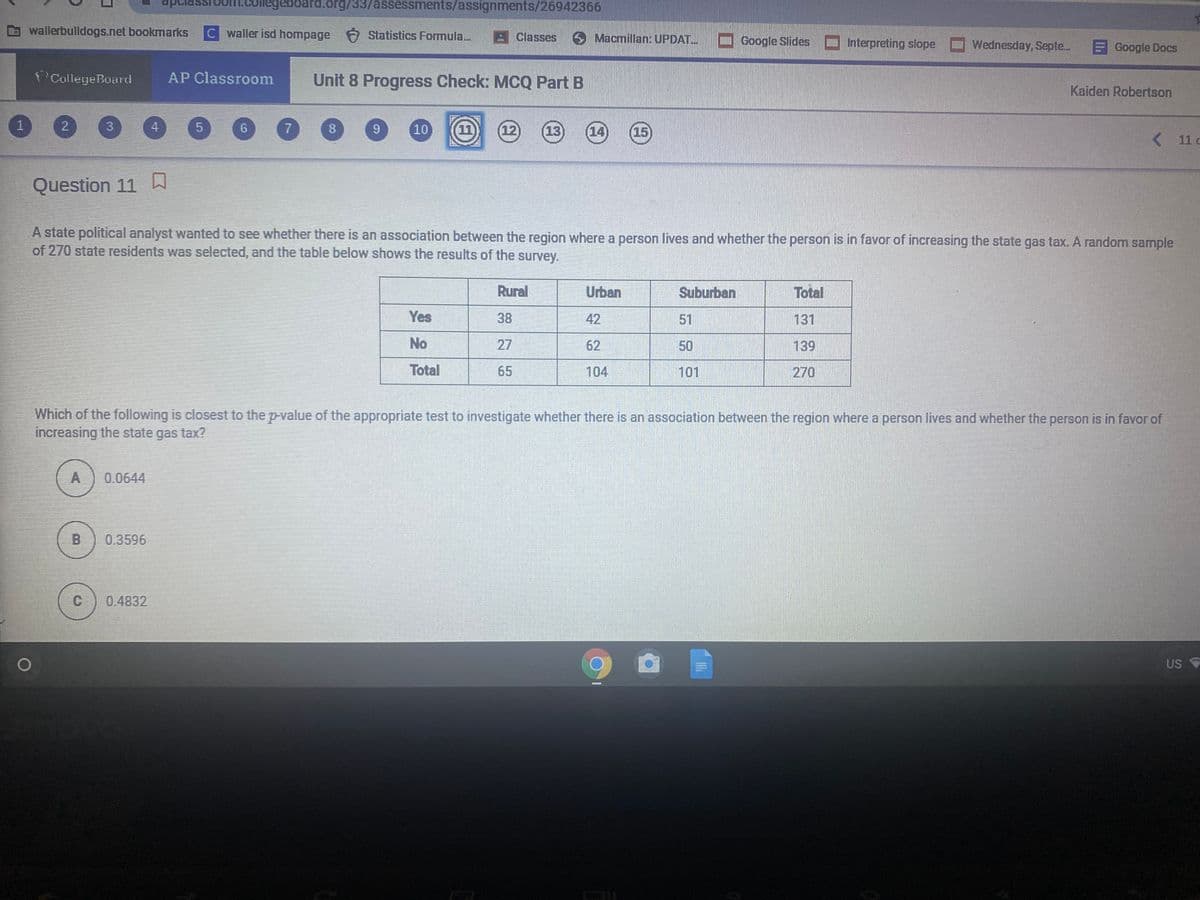
A state political analyst wanted to see whether there is an association between the region where a person lives and whether the person is in favor of increasing the state gas tax. A random sample
of 270 state residents was selected, and the table below shows the results of the survey.
Rural
Urban
Suburban
Total
Yes
38
42
51
131
No
27
62
50
139
Total
65
104
101
270
Which of the following is closest to the p-value of the appropriate test to investigate whether there is an association between the region where a person lives and whether the person is in favor of
increasing the state gas tax?
0.0644
0.3596
0.4832
US
Expert Solution
This question has been solved!
Explore an expertly crafted, step-by-step solution for a thorough understanding of key concepts.

This is a popular solution!

Trending now
This is a popular solution!

Step by step
Solved in 2 steps

Knowledge Booster


Learn more about
Need a deep-dive on the concept behind this application? Look no further. Learn more about this topic, statistics and related others by exploring similar questions and additional content below.Recommended textbooks for you
Holt Mcdougal Larson Pre-algebra: Student Edition…
Algebra
ISBN:
9780547587776
Author:
HOLT MCDOUGAL
Publisher:
HOLT MCDOUGAL
Holt Mcdougal Larson Pre-algebra: Student Edition…
Algebra
ISBN:
9780547587776
Author:
HOLT MCDOUGAL
Publisher:
HOLT MCDOUGAL