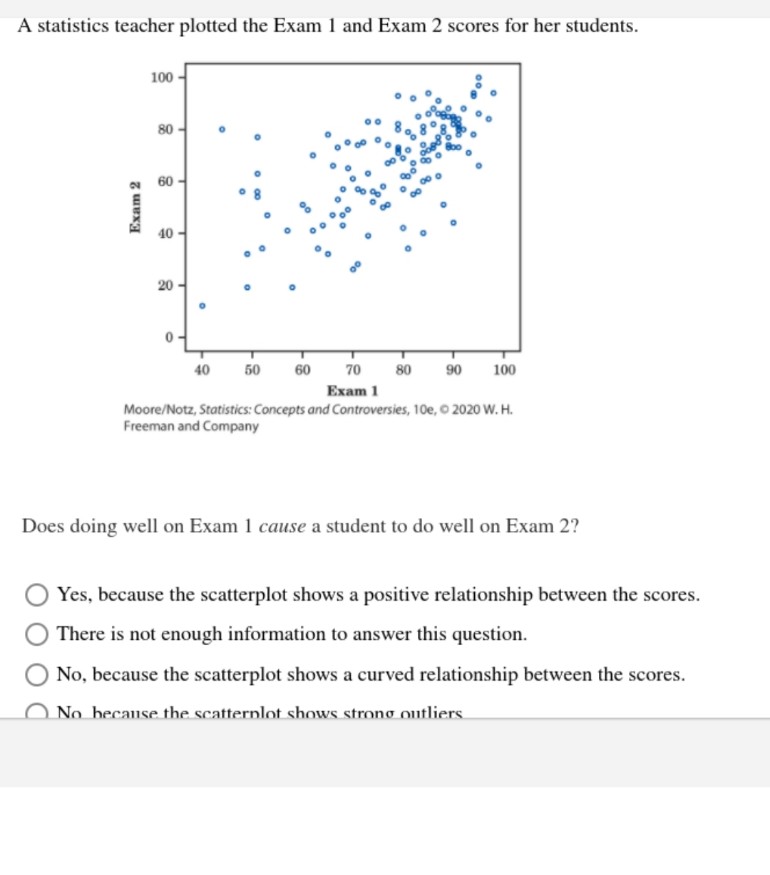
A statistics teacher plotted the Exam 1 and Exam 2 scores for her students. 100 80 40 20 40 50 60 70 80 90 100 Exam 1 Moore/Notz, Statistics: Concepts and Controversies, 10e, o 2020 W. H. Freeman and Company Does doing well on Exam 1 cause a student to do well on Exam 2? Yes, because the scatterplot shows a positive relationship between the scores. There is not enough information to answer this question. No, because the scatterplot shows a curved relationship between the scores. No because the scatternlot shows strono outliers Exam 2


Inverse Normal Distribution
The method used for finding the corresponding z-critical value in a normal distribution using the known probability is said to be an inverse normal distribution. The inverse normal distribution is a continuous probability distribution with a family of two parameters.
Mean, Median, Mode
It is a descriptive summary of a data set. It can be defined by using some of the measures. The central tendencies do not provide information regarding individual data from the dataset. However, they give a summary of the data set. The central tendency or measure of central tendency is a central or typical value for a probability distribution.
Z-Scores
A z-score is a unit of measurement used in statistics to describe the position of a raw score in terms of its distance from the mean, measured with reference to standard deviation from the mean. Z-scores are useful in statistics because they allow comparison between two scores that belong to different normal distributions.


Trending now
This is a popular solution!

Step by step
Solved in 2 steps


