
MATLAB: An Introduction with Applications
6th Edition
ISBN: 9781119256830
Author: Amos Gilat
Publisher: John Wiley & Sons Inc
expand_more
expand_more
format_list_bulleted
Question


Transcribed Image Text:
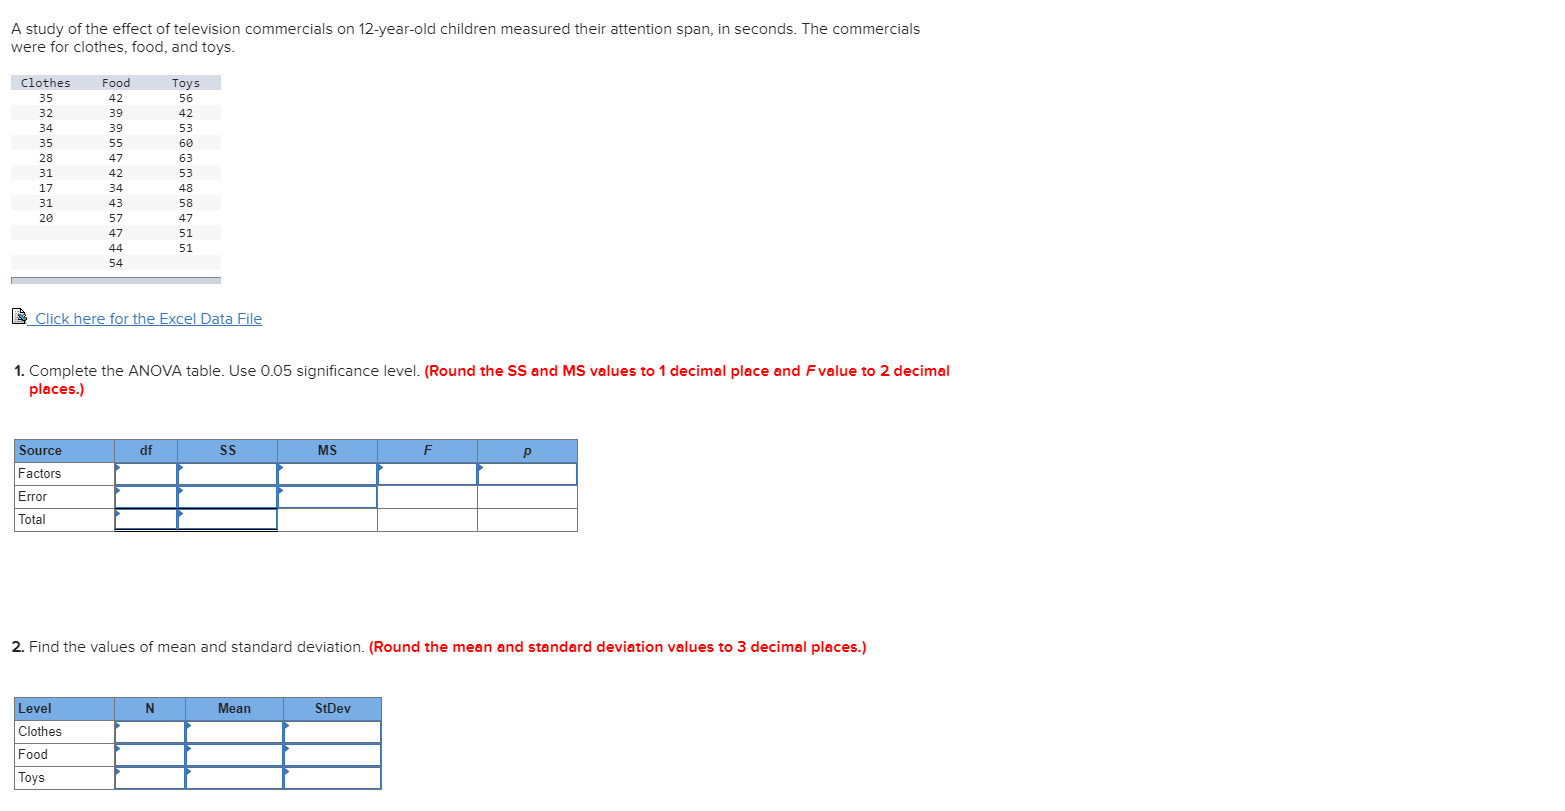
A study of the effect of television commercials on 12-year-old children measured their attention span, in seconds. The commercials
were for clothes, food, and toys.
Clothes
Food
Toys
56
35
42
32
39
42
34
39
53
35
55
60
28
47
63
31
42
53
17
34
48
31
43
58
20
57
47
47
51
44
51
54
E Click here for the Excel Data File
1. Complete the ANOVA table. Use 0.05 significance level. (Round the SS and MS values to 1 decimal place and Fvalue to 2 decimal
places.)
Source
df
MS
F
Factors
Error
Total
2. Find the values of mean and standard deviation. (Round the mean and standard deviation values to 3 decimal places.)
Level
N
Mean
StDev
Clothes
Food
Toys
Expert Solution

This question has been solved!
Explore an expertly crafted, step-by-step solution for a thorough understanding of key concepts.
This is a popular solution
Trending nowThis is a popular solution!
Step by stepSolved in 4 steps with 2 images

Knowledge Booster
Learn more about
Need a deep-dive on the concept behind this application? Look no further. Learn more about this topic, statistics and related others by exploring similar questions and additional content below.Similar questions
- The midterm and final exam grades for a statistics course are provided in the data set below. Jaymes, a student in the class, scored 86 on both exams. Treat the given data sets as samples. Midterm: 80, 78, 85, 82, 79, 79, 78, 86, 80, 84, 78, 84, 80, 84, 81, 78, 81, 82, 78, 84 Final: 81, 88, 68, 69, 69 81, 82, 86, 76, 71, 72, 68, 77, 86, 68, 83, 84, 71, 81, 87 z-score for midterm: 1.857 z-score for final: 1.181 Based on the z-scores calculated above, which of Jaymes's grades is more unusual, the midterm grade or the final exam grade? Select the correct answer below: A. The absolute value of the z-score for the final exam grade is greater than for the midterm grade, so the final exam grade is more unusual. B. The absolute value of the z-score for the midterm exam grade is less than for the final grade, so the midterm grade is more unusual. C. The absolute value of the z-score for the midterm exam grade is greater than for the final grade, so the midterm grade is more…arrow_forwardOnly letters C and Darrow_forwardSuppose the National Transportation Safety Board (NTSB) wants to examine the safety of compact cars, midsize cars, and full-size cars. It collects a sample of cars each of the cars types. The data below displays the frontal crash test performance percentages. Test whether there are statistical differences in the frontal crash test performance for each type of car. Car Sizes Compact Cars Midsize Cars Full-Size Cars 95 95 93 98 98 97 87 98 92 99 89 92 99 94 84 94 88 87 99 93 88 98 99 89 What conclusions can we draw from the follow-up t-tests? There is/are a total of ______ statistically significant difference(s) between car type pairs out of the follow-up t-tests. Options: a) 1 b) 2 c) 3 d) 4 e) 5 f) 6arrow_forward
- Twelve inmates in a particular prison took part in an anger management class. Before it began, the median score on an anger control assessment of the group was 42 (out of a maximum of 60). After the six month class, the participants scores on the same assessment were 35, 41, 40, 44, 57, 36, 39, 47, 58, 39, 42, 39. 1. Construct a boxplot of the data and explain briefly why a sign test is appropriate to use in this casearrow_forward2. Scores in the first and fourth (final) rounds for a sample of 20 golfers who competed in PGA tournaments are shown in the following table (Golfweek, February 14, 2009, and February 28, 2009). Suppose you would like to determine if the mean score for the first round of a PGA Tour event is significantly different than the mean score for the fourth and final round. Does the pressure of playing in the final round cause scores to go up? Or does the increased player concentration cause scores to come down? Player First Round Final Round Sleve McDichael 72 72 Onson Sweemey 68 68 Darryl Archideld 72 72 Anatoli Smorin 68 68 Rey McScriff 73 73 Glenallen Mixon 69 69 Mario McRlwain 74 74 Raul Chamgerlain 69 73 Mike Sernandez 70 73 Tony Smehrik 71 69 Player First Round Final Round Bobson Dugnutt 73 75…arrow_forwardThe following table shows a sample dataset of observation values of an independent variable, Age, and a dependent variable, number of toys Age 5 3 6 3 4 4 6 8 Toys 13 15 7 12 13 11 9 5 What is the value of Toys when Age is 7 (round your answer without decimal)arrow_forward
- The owner of Maumee Ford-Volvo wants to study the relationship between the age of a car and its selling price. Listed below is a random sample of 12 used cars sold at the dealership during the last year. Car Age (years) Selling Price ($000) 1 11 12.1 2 8 10.5 3 14 5.7 4 17 4.9 5 9 5.0 6 8 13.4 7 10 10.5 8 14 9.0 9 13 9.0 10 17 4.5 11 6 12.5 12 6 11.5 Click here for the Excel Data Filea. Determine the regression equation. (Negative amounts should be indicated by a minus sign. Round your answers to 3 decimal places.) a= b= Estimate the selling price of an 7-year-old car (in $000). (Round your answer to 3 decimal places.) Interpret the regression equation (in dollars). (Round your answer to the nearest dollar amount.)arrow_forwardThe researchers hypothesised that people who receive an audiovisual presentation will have a different mean level of recall of ad information as those who receive only the visual aspects of the ad. What significance test should the researchers use for testing their hypothesis?arrow_forwardPlease assist and answer questions a, b, c, d, e, f Thank you.arrow_forward
arrow_back_ios
arrow_forward_ios
Recommended textbooks for you
- MATLAB: An Introduction with ApplicationsStatisticsISBN:9781119256830Author:Amos GilatPublisher:John Wiley & Sons IncProbability and Statistics for Engineering and th...StatisticsISBN:9781305251809Author:Jay L. DevorePublisher:Cengage LearningStatistics for The Behavioral Sciences (MindTap C...StatisticsISBN:9781305504912Author:Frederick J Gravetter, Larry B. WallnauPublisher:Cengage Learning
- Elementary Statistics: Picturing the World (7th E...StatisticsISBN:9780134683416Author:Ron Larson, Betsy FarberPublisher:PEARSONThe Basic Practice of StatisticsStatisticsISBN:9781319042578Author:David S. Moore, William I. Notz, Michael A. FlignerPublisher:W. H. FreemanIntroduction to the Practice of StatisticsStatisticsISBN:9781319013387Author:David S. Moore, George P. McCabe, Bruce A. CraigPublisher:W. H. Freeman

MATLAB: An Introduction with Applications
Statistics
ISBN:9781119256830
Author:Amos Gilat
Publisher:John Wiley & Sons Inc

Probability and Statistics for Engineering and th...
Statistics
ISBN:9781305251809
Author:Jay L. Devore
Publisher:Cengage Learning

Statistics for The Behavioral Sciences (MindTap C...
Statistics
ISBN:9781305504912
Author:Frederick J Gravetter, Larry B. Wallnau
Publisher:Cengage Learning

Elementary Statistics: Picturing the World (7th E...
Statistics
ISBN:9780134683416
Author:Ron Larson, Betsy Farber
Publisher:PEARSON

The Basic Practice of Statistics
Statistics
ISBN:9781319042578
Author:David S. Moore, William I. Notz, Michael A. Fligner
Publisher:W. H. Freeman

Introduction to the Practice of Statistics
Statistics
ISBN:9781319013387
Author:David S. Moore, George P. McCabe, Bruce A. Craig
Publisher:W. H. Freeman