A study was conducted to determine the effectiveness of a certain treatment. A group of 112 patients were randomly divided into an experimental group and a control group. The table shows the result for their net improvement. Let the experimental group be group 1 and the control group be group 2. E Click the icon to view the net improvement results. (a) Test whether the experimental group experienced a larger mean improvement than the control group at the a=0.01 level of significance. State the null and alternative hypotheses. Choose the correct answer below. A. Ho: H1 = H2 and H1: H1>H2 O B. Ho H1= H2 and H1: 1 < P2 O C. Ho: H1 =H2 and H1: H1 # H2 Determine the P-value for this hypothesis test. P-value = (Round to three decimal places as needed.)
A study was conducted to determine the effectiveness of a certain treatment. A group of 112 patients were randomly divided into an experimental group and a control group. The table shows the result for their net improvement. Let the experimental group be group 1 and the control group be group 2. E Click the icon to view the net improvement results. (a) Test whether the experimental group experienced a larger mean improvement than the control group at the a=0.01 level of significance. State the null and alternative hypotheses. Choose the correct answer below. A. Ho: H1 = H2 and H1: H1>H2 O B. Ho H1= H2 and H1: 1 < P2 O C. Ho: H1 =H2 and H1: H1 # H2 Determine the P-value for this hypothesis test. P-value = (Round to three decimal places as needed.)

Glencoe Algebra 1, Student Edition, 9780079039897, 0079039898, 2018
18th Edition
ISBN:9780079039897
Author:Carter
Publisher:Carter
Chapter10: Statistics
Section10.3: Measures Of Spread
Problem 1GP

Related questions
Question
4/12
Determine the P value for this hypothesis test. P value =_. Round to three decimal places as needed
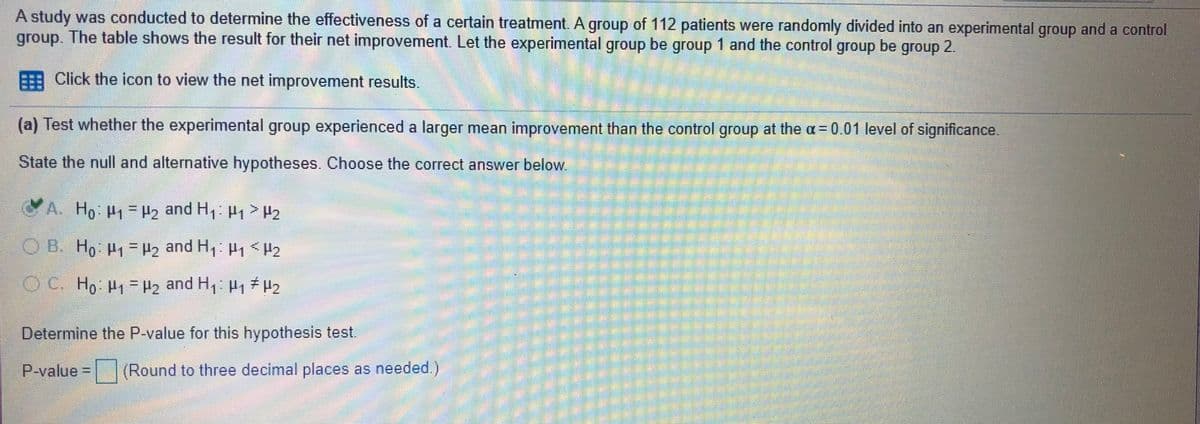
Transcribed Image Text:A study was conducted to determine the effectiveness of a certain treatment. A group of 112 patients were randomly divided into an experimental group and a control
group. The table shows the result for their net improvement. Let the experimental group be group 1 and the control group be group 2.
Click the icon to view the net improvement results.
(a) Test whether the experimental group experienced a larger mean improvement than the control group at the a= 0.01 level of significance.
State the null and alternative hypotheses. Choose the correct answer below
A. Ho P1=2 and H1 H1 >H2
O B. Ho P1 = Hz and H1 H1 < H2
%3D
C. Ho P =H2 and H, P, 2
%3D
Determine the P-value for this hypothesis test.
P-value D
(Round to three decimal places as needed.)
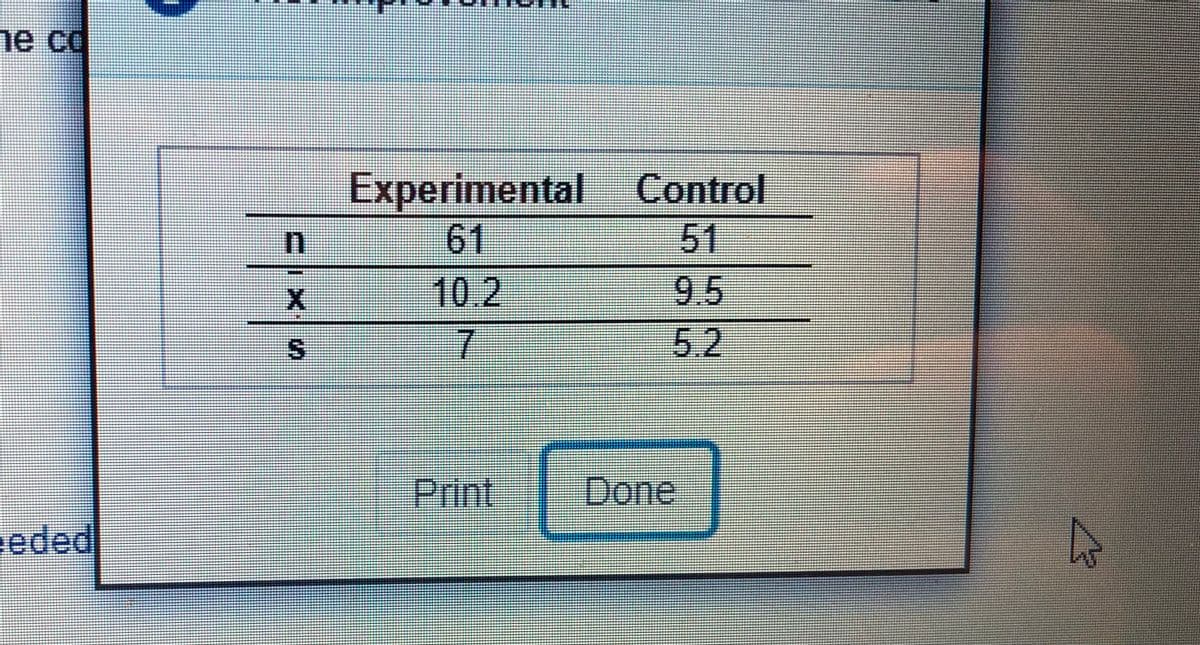
Transcribed Image Text:ne co
Experimental
61
Control
51
9.5
10.2
5.2
Print
Done
eeded
Expert Solution
This question has been solved!
Explore an expertly crafted, step-by-step solution for a thorough understanding of key concepts.

This is a popular solution!

Trending now
This is a popular solution!

Step by step
Solved in 4 steps with 2 images

Knowledge Booster


Learn more about
Need a deep-dive on the concept behind this application? Look no further. Learn more about this topic, statistics and related others by exploring similar questions and additional content below.Recommended textbooks for you
Glencoe Algebra 1, Student Edition, 9780079039897…
Algebra
ISBN:
9780079039897
Author:
Carter
Publisher:
McGraw Hill

College Algebra (MindTap Course List)
Algebra
ISBN:
9781305652231
Author:
R. David Gustafson, Jeff Hughes
Publisher:
Cengage Learning
Glencoe Algebra 1, Student Edition, 9780079039897…
Algebra
ISBN:
9780079039897
Author:
Carter
Publisher:
McGraw Hill
College Algebra (MindTap Course List)
Algebra
ISBN:
9781305652231
Author:
R. David Gustafson, Jeff Hughes
Publisher:
Cengage Learning