A study was conducted to determine the proportion of people who dream in black and white instead of color. Among 297 people over the age of 55, 64 dream in black and white, and among 312 people under the age of 25, 12 dream in black and white. Use a 0.05 significance level to test the claim that the proportion of people over 55 who dream in black and white is greater than the proportion for those under 25. Complete parts (a) through (c) below. *** evidence to support the claim that the proportion of people over 55 who dream in black and white is greater than the proportion for those under 25. b. Test the claim by constructing an appropriate confidence interval. The 90% confidence interval is < (P₁-P₂) < (Round to three decimal places as needed.) What is the conclusion based on the confidence interval? Because the confidence interval limits confidence interval limits include dream in black and white is 0, it appears that the two proportions an Because the values, it appears that the proportion of people over 55 who the proportion for those under 25. c. An explanation for the results is that those over the age of 55 grew up exposed to media that was displayed in black and white. Can these results be used to verify that explanation? OA. Yes. The results can be used to verify the given explanation because the difference in proportions is statistically significant. B. No. The results speak to a possible difference between the proportions of people over 55 and under 25 who dream in black and white, but the results cannot be used to verify the cause of such a difference. OC. No. The results speak to a possible difference between the proportions of people over 55 and under 25 who dream in black and white, but the results are not statistically significant enough to verify the cause of such a difference. OD. Yes. The results can be used to verify the given explanation because the difference in proportions is practically ur
A study was conducted to determine the proportion of people who dream in black and white instead of color. Among 297 people over the age of 55, 64 dream in black and white, and among 312 people under the age of 25, 12 dream in black and white. Use a 0.05 significance level to test the claim that the proportion of people over 55 who dream in black and white is greater than the proportion for those under 25. Complete parts (a) through (c) below. *** evidence to support the claim that the proportion of people over 55 who dream in black and white is greater than the proportion for those under 25. b. Test the claim by constructing an appropriate confidence interval. The 90% confidence interval is < (P₁-P₂) < (Round to three decimal places as needed.) What is the conclusion based on the confidence interval? Because the confidence interval limits confidence interval limits include dream in black and white is 0, it appears that the two proportions an Because the values, it appears that the proportion of people over 55 who the proportion for those under 25. c. An explanation for the results is that those over the age of 55 grew up exposed to media that was displayed in black and white. Can these results be used to verify that explanation? OA. Yes. The results can be used to verify the given explanation because the difference in proportions is statistically significant. B. No. The results speak to a possible difference between the proportions of people over 55 and under 25 who dream in black and white, but the results cannot be used to verify the cause of such a difference. OC. No. The results speak to a possible difference between the proportions of people over 55 and under 25 who dream in black and white, but the results are not statistically significant enough to verify the cause of such a difference. OD. Yes. The results can be used to verify the given explanation because the difference in proportions is practically ur

Glencoe Algebra 1, Student Edition, 9780079039897, 0079039898, 2018
18th Edition
ISBN:9780079039897
Author:Carter
Publisher:Carter
Chapter10: Statistics
Section10.6: Summarizing Categorical Data
Problem 30PPS

Related questions
Question
5
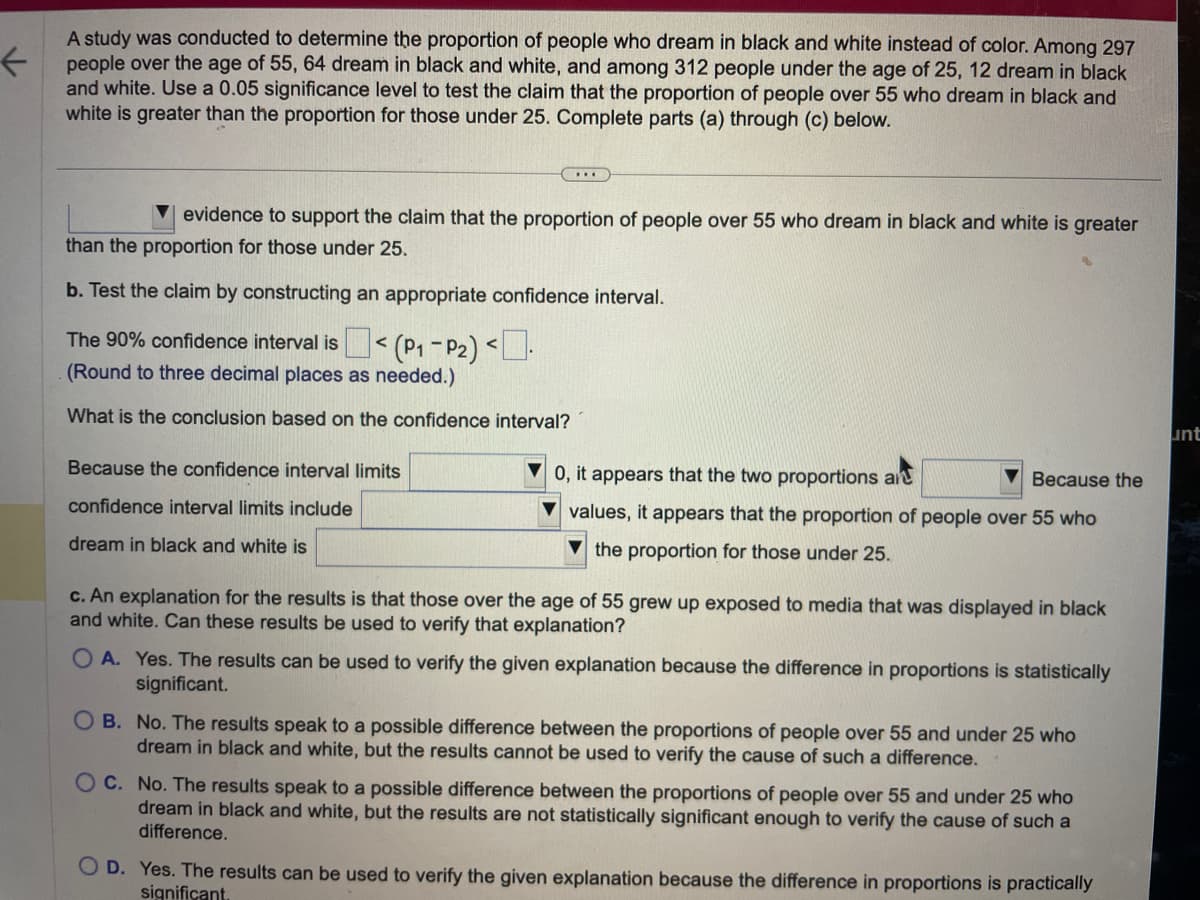
Transcribed Image Text:A study was conducted to determine the proportion of people who dream in black and white instead of color. Among 297
people over the age of 55, 64 dream in black and white, and among 312 people under the age of 25, 12 dream in black
and white. Use a 0.05 significance level to test the claim that the proportion of people over 55 who dream in black and
white is greater than the proportion for those under 25. Complete parts (a) through (c) below.
…….
evidence to support the claim that the proportion of people over 55 who dream in black and white is greater
than the proportion for those under 25.
b. Test the claim by constructing an appropriate confidence interval.
The 90% confidence interval is < (P₁-P₂) <.
(Round to three decimal places as needed.)
What is the conclusion based on the confidence interval?
Because the confidence interval limits
confidence interval limits include
dream in black and white is
0, it appears that the two proportions ar
Because the
values, it appears that the proportion of people over 55 who
the proportion for those under 25.
c. An explanation for the results is that those over the age of 55 grew up exposed to media that was displayed in black
and white. Can these results be used to verify that explanation?
OA. Yes. The results can be used to verify the given explanation because the difference in proportions is statistically
significant.
OB. No. The results speak to a possible difference between the proportions of people over 55 and under 25 who
dream in black and white, but the results cannot be used to verify the cause of such a difference.
OC. No. The results speak to a possible difference between the proportions of people over 55 and under 25 who
dream in black and white, but the results are not statistically significant enough to verify the cause of such a
difference.
OD. Yes. The results can be used to verify the given explanation because the difference in proportions is practically
significant.
unt
Transcribed Image Text:KEPUTY
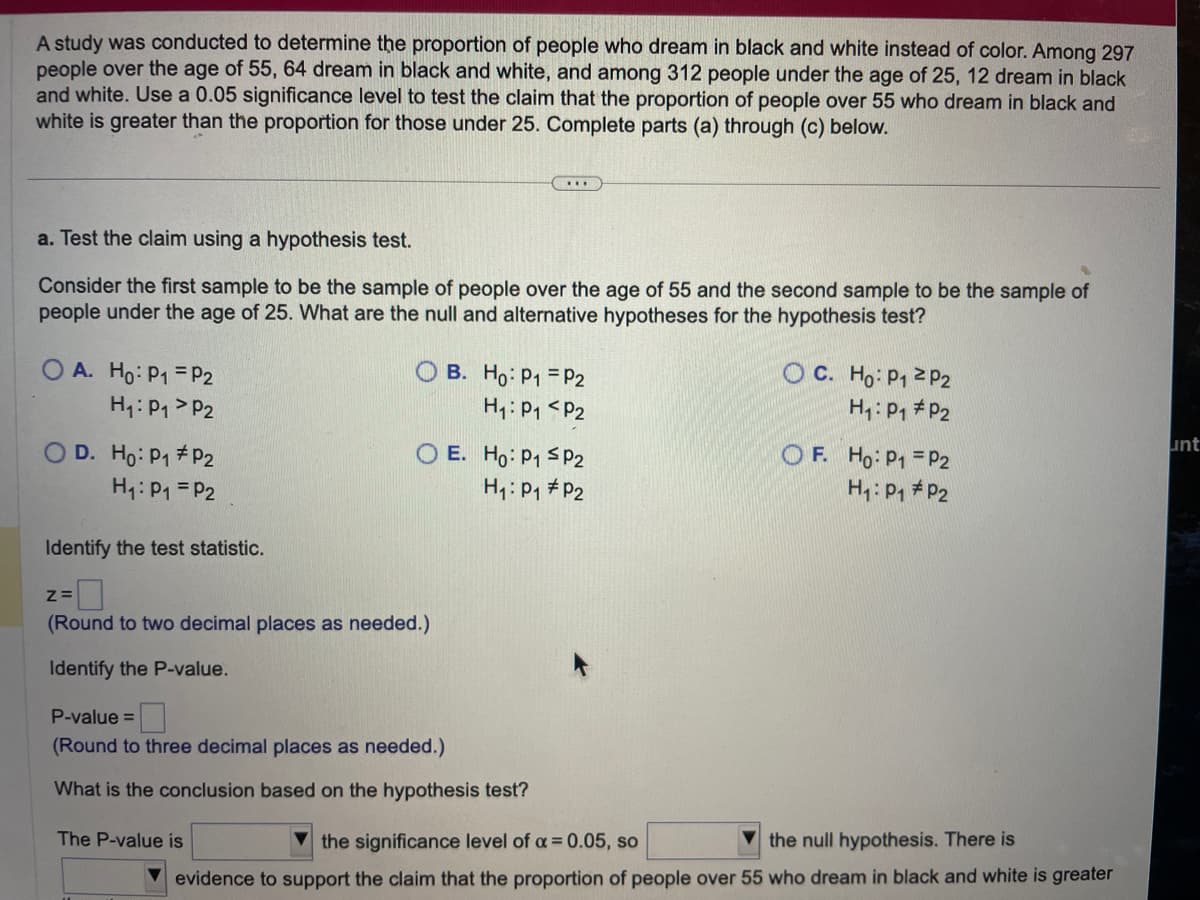
A study was conducted to determine the proportion of people who dream in black and white instead of color. Among 297
people over the age of 55, 64 dream in black and white, and among 312 people under the age of 25, 12 dream in black
and white. Use a 0.05 significance level to test the claim that the proportion of people over 55 who dream in black and
white is greater than the proportion for those under 25. Complete parts (a) through (c) below.
a. Test the claim using a hypothesis test.
A
Consider the first sample to be the sample of people over the age of 55 and the second sample to be the sample of
people under the age of 25. What are the null and alternative hypotheses for the hypothesis test?
OA. Ho: P1 = P2
H₁: P₁ P2
OD. Ho: P1 P2
H₁: P₁ = P2
Identify the test statistic.
OB. Ho: P1 P2
H₁: P₁
P2
O E. Ho: P₁ P2
H₁: P₁ P2
Z=
(Round to two decimal places as needed.)
Identify the P-value.
The P-value is
P-value
(Round to three decimal places as needed.)
What is the conclusion based on the hypothesis test?
OC. Ho: P₁
P2
H₁: P₁ P2
OF. Ho: P₁ = P2
H₁: P₁ P2
the significance level of a = 0.05, so
the null hypothesis. There is
evidence to support the claim that the proportion of people over 55 who dream in black and white is greater
unt
Expert Solution
This question has been solved!
Explore an expertly crafted, step-by-step solution for a thorough understanding of key concepts.

This is a popular solution!

Trending now
This is a popular solution!

Step by step
Solved in 4 steps with 2 images

Recommended textbooks for you
Glencoe Algebra 1, Student Edition, 9780079039897…
Algebra
ISBN:
9780079039897
Author:
Carter
Publisher:
McGraw Hill

College Algebra (MindTap Course List)
Algebra
ISBN:
9781305652231
Author:
R. David Gustafson, Jeff Hughes
Publisher:
Cengage Learning

Glencoe Algebra 1, Student Edition, 9780079039897…
Algebra
ISBN:
9780079039897
Author:
Carter
Publisher:
McGraw Hill
College Algebra (MindTap Course List)
Algebra
ISBN:
9781305652231
Author:
R. David Gustafson, Jeff Hughes
Publisher:
Cengage Learning