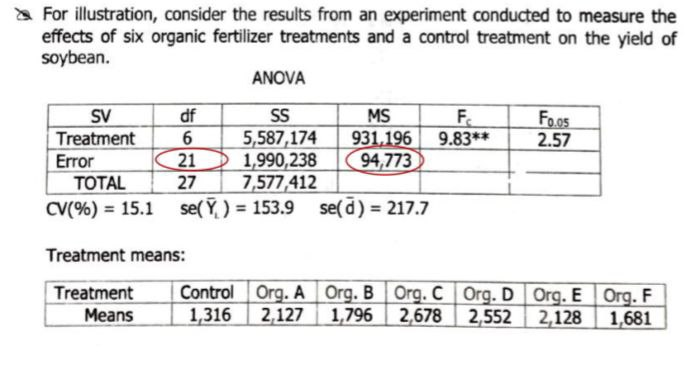
For illustration, consider the results from an experiment conducted to measure the effects of six organic fertilizer treatments and a control treatment on the yield of soybean. ANOVA SV Treatment MS 931,196 94,773 F. df 6 S Foos 2.57 5,587,174 1,990,238 7,577,412 CV(%) = 15.1 se(Y, ) = 153.9 se(d) = 217.7 9.83** 21 27 Error TOTAL Treatment means: Control Org. A Org. B Org. C Org. D Org. E Org. F 1,316 Treatment Means 2,127 1,796 2,678 2,552 2,128 1,681
For illustration, consider the results from an experiment conducted to measure the effects of six organic fertilizer treatments and a control treatment on the yield of soybean. ANOVA SV Treatment MS 931,196 94,773 F. df 6 S Foos 2.57 5,587,174 1,990,238 7,577,412 CV(%) = 15.1 se(Y, ) = 153.9 se(d) = 217.7 9.83** 21 27 Error TOTAL Treatment means: Control Org. A Org. B Org. C Org. D Org. E Org. F 1,316 Treatment Means 2,127 1,796 2,678 2,552 2,128 1,681

MATLAB: An Introduction with Applications
6th Edition
ISBN:9781119256830
Author:Amos Gilat
Publisher:Amos Gilat
Chapter1: Starting With Matlab
Section: Chapter Questions
Problem 1P

Related questions
Question
With Scheffe's S Test, perform the pairwise comparisons of the means and summarize the result of comparisons. Below are the data:
Transcribed Image Text:a For illustration, consider the results from an experiment conducted to measure the
effects of six organic fertilizer treatments and a control treatment on the yield of
soybean.
ANOVA
SV
df
S
MS
931,196 9.83**
94,773
F.
Treatment
Foos
2.57
5,587,174
1,990,238
7,577,412
se( Y, ) = 153.9 se(d) = 217.7
21
Error
TOTAL
27
CV(%) = 15.1
Treatment means:
Control Org. A Org. B Org. C Org. D Org. E Org. F
2,678
Treatment
Means
1,316
2,127
1,796
2,552 2,128
1,681
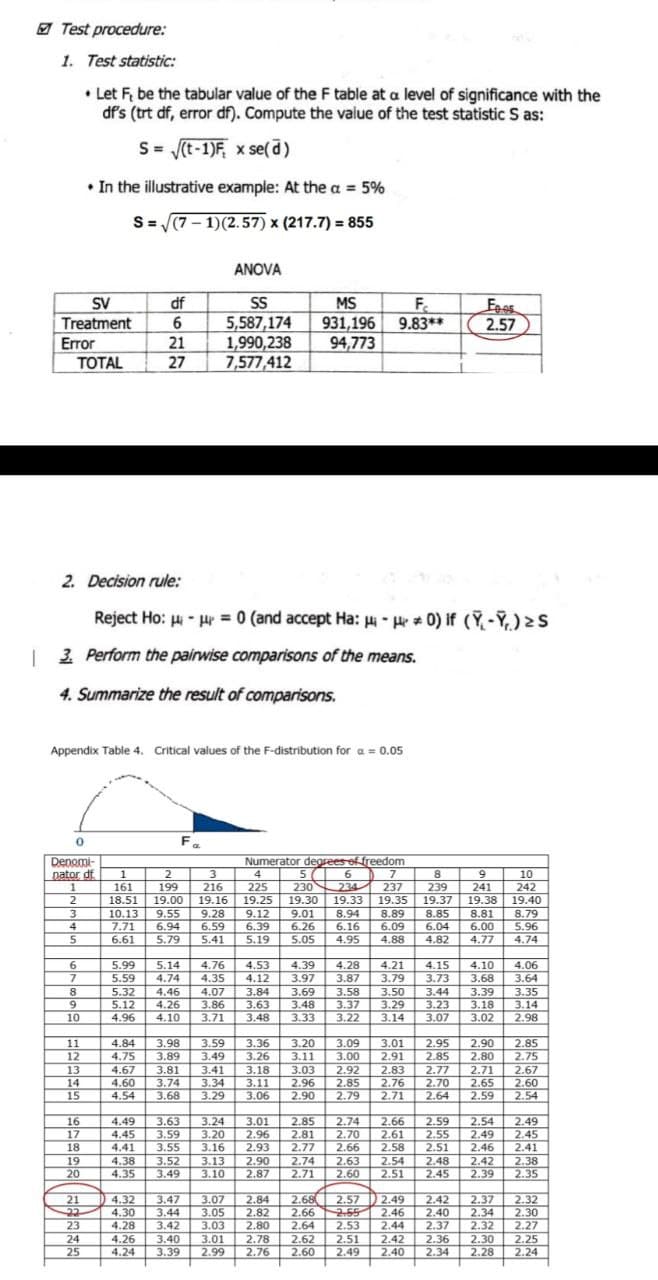
Transcribed Image Text:Test procedure:
1. Test statistic:
• Let F, be the tabular value of the F table at a level of significance with the
df's (trt df, error df). Compute the vaiue of the test statistic S as:
S= (t-1)F, x se(d)
• In the illustrative example: At the a = 5%
S= (7 – 1)(2.57) x (217.7) = 855
ANOVA
df
MS
SV
Treatment
S
F.
931,196
94,773
5,587,174
9.83**
2.57
Error
ТOTAL
21
1,990,238
7,577,412
27
2. Decision rule:
Reject Ho: H - pr = 0 (and accept Ha: Hi - He* 0) if (Y -Y, ) > S
| 3 Perform the pairwise comparisons of the means.
4. Summarize the result of comparisons.
Appendix Table 4. Critical values of the F-distribution for a= 0.05
Fa
Denomi-
nator df
Numerator degrees of freedom
6.
5
230 234
19.30
1
2
3
216
4
7
9
10
161
199
225
237
239
241
242
19.40
2
18.51
19.00
19.16
19.25
19.33
19.35
19.37
19.38
9.55
6.94
5.79
9.28
9.01
6.26
8.94
6.16
8.79
5.96
3
10.13
7.71
6.61
9.12
6.39
8.89
6.09
4.88
8.85
8.81
6.00
4.77
4
6.59
6.04
5
5.41
5.19
5.05
4.95
4.82
4.74
6.
5.99
5.14
4.76
4.53
4.39
4.28
4.21
4.15
3.73
4.10
4.06
4.35
4.12
3.87
3.58
3.37
3.22
7.
5.59
4.74
3.97
3.79
3.68
3.64
8
9
5.32
5.12
4.96
4.46
4.26
4.10
4.07
3.86
3.71
3.84
3.63
3.48
3.69
3.48
3.33
3.50
3.29
3.14
3.44
3.23
3.07
3.39
3.35
3.14
2.98
3.18
10
3.02
3.59
3.20
2.90
2.80
2.71
2.65
3.98
3.89
2.95
2.85
4.84
3.36
3.09
3.00
3.01
2.91
2.85
2.75
11
12
4.75
4.67
4.60
4.54
3.49
3.26
3.11
3.41
3.34
3.29
3.18
3.11
3.06
2.83
2.76
2.71
2.77
2.70
2.64
13
3.81
3.03
2.96
2.90
2.92
2.67
14
15
3.74
2.85
2.79
2.60
2.54
3.68
2.59
3.24
3.20
3.16
2.59
2.55
2.51
3.01
2.74
2.70
2.85
2.81
2.77
2.54
2.49
2.46
2.42
2.39 2.35
2.49
2.45
2.41
16
17
4.49
4.45
4.41
3.63
3.59
3.55
2.96
2.93
2.66
2.61
2.58
18
2.66
2.74
2.71
2.63
2.60
19
4.38
4.35
3.52
3.49
3.13
3.10
2.90
2.87
2.54
2.51
2.48
2.45
2.38
20
2.84
2.82
2.80
2.68
2.66
2.64
2.62
2.60
2.57 D 2.49
2.55
2.53
2.42
2.40
2.37
2.37
2.34
2.32
2.32
2.30
2.27
21
4.32
4.30
4.28
3.47
22
23
3.44
3.42
3.07
3.05
3.03
2.46
2.44
2.51
2.42
2.40
2.36
2.34
24
4.26
3.40
3.01
2.99
2.78
2.30
2.25
25
4.24
3.39
2.76
2.49
2.28
2.24
Expert Solution
This question has been solved!
Explore an expertly crafted, step-by-step solution for a thorough understanding of key concepts.

Step by step
Solved in 2 steps with 5 images

Recommended textbooks for you
MATLAB: An Introduction with Applications
Statistics
ISBN:
9781119256830
Author:
Amos Gilat
Publisher:
John Wiley & Sons Inc

Probability and Statistics for Engineering and th…
Statistics
ISBN:
9781305251809
Author:
Jay L. Devore
Publisher:
Cengage Learning

Statistics for The Behavioral Sciences (MindTap C…
Statistics
ISBN:
9781305504912
Author:
Frederick J Gravetter, Larry B. Wallnau
Publisher:
Cengage Learning
MATLAB: An Introduction with Applications
Statistics
ISBN:
9781119256830
Author:
Amos Gilat
Publisher:
John Wiley & Sons Inc
Probability and Statistics for Engineering and th…
Statistics
ISBN:
9781305251809
Author:
Jay L. Devore
Publisher:
Cengage Learning
Statistics for The Behavioral Sciences (MindTap C…
Statistics
ISBN:
9781305504912
Author:
Frederick J Gravetter, Larry B. Wallnau
Publisher:
Cengage Learning

Elementary Statistics: Picturing the World (7th E…
Statistics
ISBN:
9780134683416
Author:
Ron Larson, Betsy Farber
Publisher:
PEARSON

The Basic Practice of Statistics
Statistics
ISBN:
9781319042578
Author:
David S. Moore, William I. Notz, Michael A. Fligner
Publisher:
W. H. Freeman

Introduction to the Practice of Statistics
Statistics
ISBN:
9781319013387
Author:
David S. Moore, George P. McCabe, Bruce A. Craig
Publisher:
W. H. Freeman