A totally different study of sales ( y ) with respect to æ = advertising expenditure in a given retail business gave the following figures: n = 17 , Σ 1.637.05, Σ u 300.48, Σr 179,856.81, E r; ; =32,304.25, E =6,459.55.
A totally different study of sales ( y ) with respect to æ = advertising expenditure in a given retail business gave the following figures: n = 17 , Σ 1.637.05, Σ u 300.48, Σr 179,856.81, E r; ; =32,304.25, E =6,459.55.

Glencoe Algebra 1, Student Edition, 9780079039897, 0079039898, 2018
18th Edition
ISBN:9780079039897
Author:Carter
Publisher:Carter
Chapter4: Equations Of Linear Functions
Section4.5: Correlation And Causation
Problem 23PFA

Related questions
Question
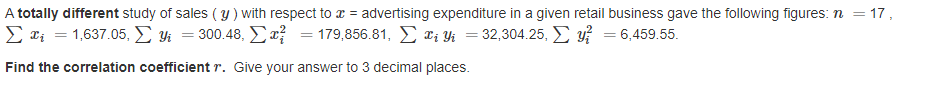
Transcribed Image Text:A totally different study of sales ( y) with respect to r = advertising expenditure in a given retail business gave the following figures: n = 17,
Σ 1.637.05, Σ u - 300.48, Σ
179,856.81, E T; Yi =32,304.25, E y = 6,459.55.
%3D
Find the correlation coefficient r. Give your answer to 3 decimal places.
Expert Solution
This question has been solved!
Explore an expertly crafted, step-by-step solution for a thorough understanding of key concepts.

Step by step
Solved in 2 steps

Recommended textbooks for you
Glencoe Algebra 1, Student Edition, 9780079039897…
Algebra
ISBN:
9780079039897
Author:
Carter
Publisher:
McGraw Hill
Glencoe Algebra 1, Student Edition, 9780079039897…
Algebra
ISBN:
9780079039897
Author:
Carter
Publisher:
McGraw Hill