In an experiment the following correspondence was found between temperature T (in °C) and electrical resistance R (in ΜΩ):
In an experiment the following correspondence was found between temperature T (in °C) and electrical resistance R (in ΜΩ):

Linear Algebra: A Modern Introduction
4th Edition
ISBN:9781285463247
Author:David Poole
Publisher:David Poole
Chapter7: Distance And Approximation
Section7.3: Least Squares Approximation
Problem 34EQ

Related questions

Concept explainers
Ratios
A ratio is a comparison between two numbers of the same kind. It represents how many times one number contains another. It also represents how small or large one number is compared to the other.
Trigonometric Ratios
Trigonometric ratios give values of trigonometric functions. It always deals with triangles that have one angle measuring 90 degrees. These triangles are right-angled. We take the ratio of sides of these triangles.
Question
Transcribed Image Text:qua
quadratic function f
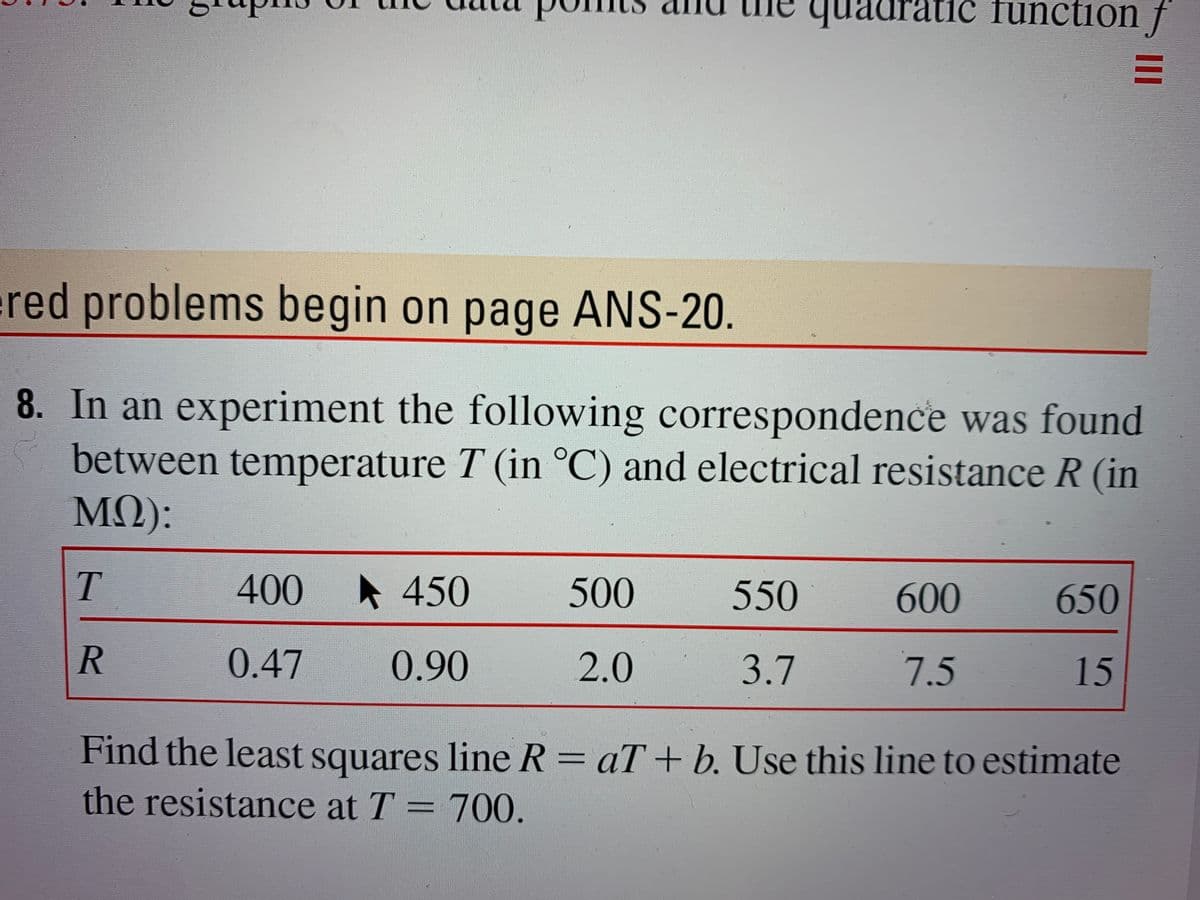
red problems begin on page ANS-20.
8. In an experiment the following correspondence was found
between temperature T (in °C) and electrical resistance R (in
MQ):
T.
400
A 450
500
550
600
650
0.47
0.90
2.0
3.7
7.5
15
Find the least squares line R= aT+ b. Use this line to estimate
the resistance at T = 700.
Expert Solution
This question has been solved!
Explore an expertly crafted, step-by-step solution for a thorough understanding of key concepts.

This is a popular solution!

Trending now
This is a popular solution!

Step by step
Solved in 2 steps with 1 images

Knowledge Booster


Learn more about
Need a deep-dive on the concept behind this application? Look no further. Learn more about this topic, statistics and related others by exploring similar questions and additional content below.Recommended textbooks for you
Linear Algebra: A Modern Introduction
Algebra
ISBN:
9781285463247
Author:
David Poole
Publisher:
Cengage Learning

Algebra & Trigonometry with Analytic Geometry
Algebra
ISBN:
9781133382119
Author:
Swokowski
Publisher:
Cengage
Linear Algebra: A Modern Introduction
Algebra
ISBN:
9781285463247
Author:
David Poole
Publisher:
Cengage Learning
Algebra & Trigonometry with Analytic Geometry
Algebra
ISBN:
9781133382119
Author:
Swokowski
Publisher:
Cengage