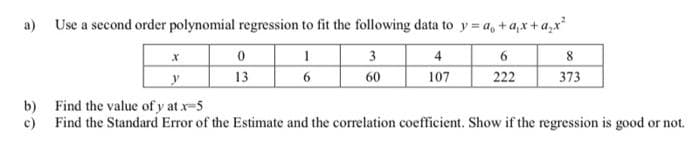
a) Use a second order polynomial regression to fit the following data to y = a, +a,x+a,x 3 4 8 13 60 107 222 373 b) Find the value of y at x-5 c) Find the Standard Error of the Estimate and the correlation coefficient. Show if the regression is good or not.
Q: Use least-squares regression to fit a straight line to Along with the slope and intercept, compute…
A: Given data for the X and Y variables : X Y 0 5 2 6 4 7 6 6 9 9 11 8 12 7 15 10…
Q: Assume that the two variables x and y are related according to the simple linear regression model.…
A: We know, Slope=∑ xy-1n∑ x∑ y∑ x2-1n∑ x2 =1687.9-115×53×582167.42-115×532 =18.567
Q: The following table gives the ages and blood pressure of 9 women. Age (X) : 56 42 36 47 49 42 60 72…
A: From given data, X Y X*Y X*X Y*Y 56 147 8232 3136 21609 42 125 5250 1764 15625 36 118 4248…
Q: Using 27 observations on each variable, a computer program generated the following multiple…
A: Significant regression slope t test: The significant regression slope t test is used to test the…
Q: Q4// Evaluate the coefficient a, b from the below data using least square regression method, then…
A:
Q: c. Use the following data to estimate y(2) based on the following methods: (i) linear interpolation…
A: The given data is: x y x2 xy 1.20 4.00 1.44 4.80 2.30 20.00 5.29 46.00 3.20 24.00 10.24…
Q: Show that the least squares point estimates of Bo and B1 for the regression model Y Bo + B1x + e are…
A:
Q: Use the given data set to derive a quadratic regression function as y(x) = ao + ax + ax? by using…
A: To derive a quadratic regression a0+a1x+a2x2=0 using least square construct the table as follows,
Q: he following data is given: 1 3 4 6. 9 12 14 y 4 5 6. 7 9. 11 se linear least-squares regression to…
A: make a table as follows x y x-x y-y x-x2 x-xy-y 1 2 -6 -4.2857 36 25.7143 3 4 -4 -2.2857 16…
Q: The following table gives indices of industrial production of registered unemployed (in hundred…
A: Here Index of production depends on the no. Of unemployed. So Index of production (Y) is dependent…
Q: Find b0 and b1 and derive the regression line equation for the data below: x y 0 2 1 3 2 5 3 7 4 10…
A: From given data, X Y X*Y X*X 0 2 0 0 1 3 3 1 2 5 10 4 3 7 21 9 4 10 40 16…
Q: X y 2. Use the least squares regression to fit a straight line to 0 2 6 9 5 6 6 9 4 7 11 8 12 8 15…
A: MATLAB CODE: INPUT clcclearx=[0 2 4 6 9 11 12 15 17 19]y=[5 6 7 6 9 8 8 10 12…
Q: The table shows the corresponding values of three variables, X,, X, and X,. Find the least square…
A:
Q: The following data is given: 1 3 4 9. 12 14 y 2 4 5 7 9 11 Use linear least-squares regression to…
A:
Q: 2. Using the same approach as was employed to derive the regression equations, derive the least-…
A: Given: x 2 4 6 7 10 11 14 17 20 y 4 5 6 5 8 8 6 9 12 To find: Graphical representation.
Q: a) The grades of a class of 9 students on a mid term report(X) and the final examination(Y) are as…
A: (a) Let X denote the Mid term report Let Y denote the final examination Calculation: From the…
Q: H.w: COMPUTE the CORELATON and the REGRESSION EQUATION for the variable yı and xi X 3 6. 15 18 21 24…
A: X:- 0, 3, 6, 9, 12, 15, 18, 21, 24, 27, 30, 33, 36 Y:- 2, 6, 12, 18, 24, 30, 36, 40, 44, 49, 55, 61,…
Q: The owner of Showtime Movie Theaters, Inc., used multiple regression analysis to predict gross…
A:
Q: Listed below are the overhead widths (cm) of seals measured from photographs and the weights (kg) of…
A: SolutionLet X be independent variable, overhead width (cm) and Y be the dependent variable, weight…
Q: Based on your answer in (b), explain on the strength and the variation of the model. (e) At…
A: R2 measures the strength of the relationship between the model and the dependent variable Given, α…
Q: A researcher is interested in learning how strong is the association be- tween the sodium intake and…
A:
Q: One of the objectives of Simple Linear Regression is finding the values of the intercept (bo) and…
A:
Q: Regression analysis was applied between sales data (y in $1000s) and advertising data (x in $100s)…
A: The given regression equation is = 12 + 1.8x n = 17 SSR = 225 SSE = 75 sb1 = .2683
Q: To help schedule staffing and equipment needs, a large hospital uses a multiple regression model to…
A: According to the provided data, The number of coefficients (K) = 3 Number of records found (N) = 27…
Q: The ages, t years of 7 hospital patients and their blood pressure, p mmHg are shown in Table 3.…
A: Procedure to obtain regression equation using EXCEL: Enter the data in an Excel sheet. Go to Data…
Q: Q1. Use least-square regression to fit a straight line to: 1 2 3 4 5 6 7 8 9 Ax) 1 1.5 2 3 4 5 8 10…
A: a) We use excel to fit a straight line with following steps: Step 1: Enter the data. Step 2: Go to…
Q: b) Determine the multiple regression model for this analysis.
A: Intercept = 657.053 x1 = 5.7103 x2 = -0.4169 x3 = -3.4715
Q: The following data was collected for the braking distance of an automobile at various speeds under…
A: Regression Equation: When we want to predict the value of one variable, say Y, from the given value…
Q: An experiment is performed to define the relationship between applied stress and the time to…
A: The least-square regression curve is such a curve that keeps the vertical distance between the data…
Q: Find out the regression coefficients of Y on X and of X on Y on the basis of following data: Ex =…
A:
Q: Find out the regression coefficients of Y on X and of X on Y on the basis of following data: Ex =…
A: Given, ∑X = 50X = 5∑Y = 60Y = 6∑XY = 350Variance of X = σx =4Variance of Y = σy = 9 To find,…
Q: Use least-squares regression to fit a straight line to 1 3 4 6 7 8 y 1 1.5 2 3 4 8 10 13 a) Along…
A: Regression line are used to predict the independent and dependent variable relationships. It mainly…
Q: Use the given data to find the equation of the regression line. Examine the scatterplot and identify…
A: Given data, X Y X*Y X*X 13 11.54 150.02 169 11 12.06 132.66 121 7 8.86 62.02 49 10…
Q: Find the equation of the least squares regression line of y on x, for the following sets of data:…
A:
Q: Listed below are the overhead widths (cm) of seals measured from photographs and the weights (kg) of…
A: Extrapolation:If anyone wants to estimate a value of the dependent variable for a value of…
Q: The following table gives indices of industrial production of registered unemployed (in hundred…
A: Index of production depends on no. Of unemployed so no. If unemployed (x) is independent variable…
Q: assume the final regression equation from the stepwise regression analysis of the dependent variable…
A: C = -5000 + 75 D + 0.4 S - 130 PT + 100 NE
Q: A study of the amount of rainfall and the quantity of zir pollution removed produced the following…
A: Solution: x y (x-x) (x-x)2 (y-y) (y-y)2 (x-x)(y-y) 4.3 126 -0.7 0.49 4.4444 19.75269 -3.11108…
Q: 17.6 Use least-squares regression to fit a straight line to 1. 2 3 4. 8. 6. 1.5 2 3 4 5 8. 10 13 (a)…
A:
Q: For x={1 2 3 4 5} and y={2 1 4 3 6} use normal equation (c =(ATA)-1ATy) to find with: a-) linear…
A: Given :- X={1 2 3 4 5} Y={2 1 4 3 6} n=5 we have to calculate linear regression coefficent (a…
Q: Find a and 3 by applying linear regression. yea 103 0.7 0.9 0.0588 0.2727 0.3684 0.4576 | 13 0.6191…
A: Given: Sample size n = 6 Formula Used: Y = A1 X + A2 A1 = n∑XY-∑X∑Yn∑X2-∑X2 A2 = Y-A1X
Q: Find out the regression coefficients of Y on X and of X on Y on the basis of following data: Ex =…
A:
Q: Find the quadratic regression curve through the following points (2, 5), (3, 5), (5, 3) O y =…
A: Given : three points (2,5) ; (3,5) ; (5,3) To find : Equation of the quadratic regression curve…
Q: Consider the linear regression model given by ŷ = 6.553 – 0.0312 x determination coefficient R =…
A: As per our guidelines we are suppose to do only one questionGivenregression model is y^ = 6.553…
Q: 194 220 243 263 llions) 1. Find the linear correlation coefficient of the data. 2. Fit the data into…
A:
M:15)
Trending now
This is a popular solution!
Step by step
Solved in 3 steps with 3 images
- Consider the regression modelYi = β1X1i + β2X2i + uifor i = 1, . . . ., n. (Notice that there is no constant term in the regression.)For x={1 2 3 4 5} and y={2 1 4 3 6} use normal equation (c =(ATA)-1ATy) to find with: a-) linear regression coefficients, b-) the linear regression equation, c-) residel sum of squares(RSS)Compute the least-squares regression equation for the given data set. Use a TI-84 calculator. Round the slope and y intercept to at least four decimal places. x 5 7 6 2 1 y 4 3 2 5 1 Regression line equation: =
- How are r, R, and β related to one another in bivariate regression2. A company that holds the DVD distribution rights to movies previously released only in theaters wants to estimate sales revenue of DVDs based on box office success. The box office gross (in Php millions) for each of 22 movies in the year that they were released and the DVD revenue (in Php millions) in the following year are shown below and stored in (pic) a. construct a scatter plot. b. assuming a linear relationship, use the least-squares method to determine the regression coefficients b0 and b1.The grades of a sample of 9 students on a prelim exam (x) and on the midterm exam (y) are shown in the excel worksheet. Find the regression equation
- A. Identify the regression analyses necessary for testing this initial model. B. What are the direct and indirect effects of z2 on z5?Experimenters wants to assess the association between X and Y, the scatter plot of X and Y showed a quadratic pattern. After applying the appropriate regression model, experimenters want to produce a prediciton interval for X = 20. Using StatCrunch with 95% confiendence, the result interval is 223 to 267. Provide the most appropriate interpretation of this interval.The number of initial public offerings of stock issued in a 10-year period and the total proceeds of these offerings (in millions) are shown in the table. The equation of the regression line is y=47.271x+18,712.47. Issues, x Proceeds, y425 18,758468 29,602678 43,797478 31,661485 65,518396 65,33069 21,42764 11,847181 32,392157 27,561 Complete parts a and b. The number of initial public offerings of stock issued in a 10-year period and the total proceeds of these offerings (in millions) are shown in the table. The equation of the regression line is y=47.271x+18,712.47. Complete parts a and b. (a) Find the coefficient of determination and interpret the result. (Round to three decimal places as needed.) (b) Find the standard error of estimate se and interpret the result. (Round to three decimal places as needed.)
- A company that holds the DVD distribution rights to movies previously released only in theaters wants to estimate sales revenue of DVDs based on box office success. The box office gross (in Php millions) for each of 22 movies in the year that they were released and the DVD revenue (in Php millions) in the following year are shown below and stored in a. construct a scatter plot. b. assuming a linear relationship, use the least-squares method to determine the regression coefficients b0 and b c. interpret the meaning of the slope, in this problem d. predict the sales revenue for a movie DVD that had a box office gross of Php75 million..1A linear multiple regression model is given as: Y = βo + β1 X1 + β2 X2 + μ a. Determine the parameters of this model b. Explain the circumstance under which X1 be called an endogenous variable?An experiment was performed on a certain metal to determine if the strength is a function of heating time. Results based on 10 metal sheets are given below. ∑ X = 30 ∑ X 2 = 104 ∑ Y = 40 ∑ Y 2 = 178 ∑ XY = 134 Using the simple linear regression model, find the estimated y-intercept and slope and write the equation of the least squares regression line.