
MATLAB: An Introduction with Applications
6th Edition
ISBN: 9781119256830
Author: Amos Gilat
Publisher: John Wiley & Sons Inc
expand_more
expand_more
format_list_bulleted
Related questions
Concept explainers
Question
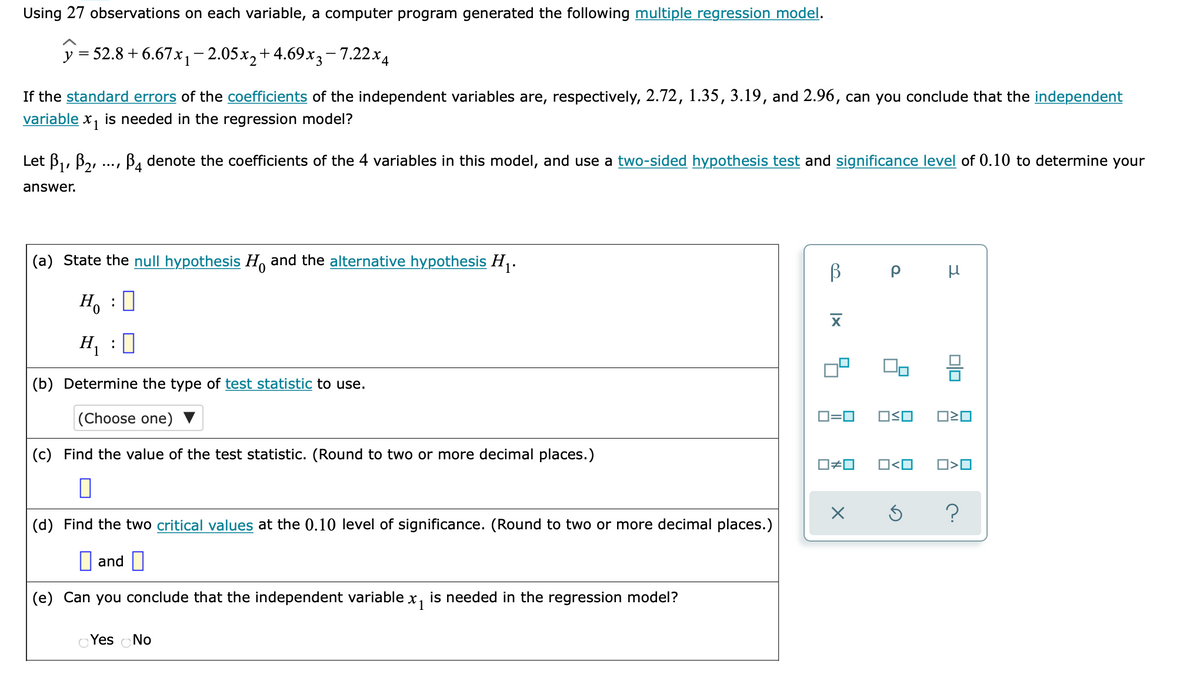

Transcribed Image Text:Using 27 observations on each variable, a computer program generated the following multiple regression model.
y = 52.8 + 6.67x1-2.05x2+4.69x3- 7.22x4
If the standard errors of the coefficients of the independent variables are, respectively, 2.72, 1.35, 3.19, and 2.96, can you conclude that the independent
variable x, is needed in the regression model?
Let B,, B,, ..., B, denote the coefficients of the 4 variables in this model, and use a two-sided hypothesis test and significance level of 0.10 to determine your
answer.
(a) State the null hypothesis H, and the alternative hypothesis H,.
Ho
H, :0
1
(b) Determine the type of test statistic to use.
D=0
OSO
(Choose one)
O#0
O<O
(c) Find the value of the test statistic. (Round to two or more decimal places.)
(d) Find the two critical values at the 0.10 level of significance. (Round to two or more decimal places.)
|| and ||
(e) Can you conclude that the independent variable x, is needed in the regression model?
OYes No
Expert Solution
This question has been solved!
Explore an expertly crafted, step-by-step solution for a thorough understanding of key concepts.

This is a popular solution

Trending nowThis is a popular solution!

Step by stepSolved in 2 steps with 2 images

Knowledge Booster


Learn more about
Need a deep-dive on the concept behind this application? Look no further. Learn more about this topic, statistics and related others by exploring similar questions and additional content below.Similar questions
- A set of n = 25 pairs of scores (X and Y values) produces a regression equation Y = 3X – 2. Findthe predicted Y value for each of the following X scores: 0, 1, 3, -2.arrow_forwardYou may need to use the appropriate technology to answer this question. A regression analysis involving 45 observations relating a dependent variable and two independent variables resulted in the following information. ý = 0.406 + 1.3385X, + 2X2 The SSE for the above model is 43. When two other independent variables were added to the model, the following information was provided. ý = 1.9 – 3X + 12X2 + 4Xg + 8x, This model's SSE is 36. At a 0.05 level of significance, test to determine if the two added independent variables contribute significantly to the model. State the relevant null and alternative hypotheses. O Ho: One or more of the parameters is not equal to zero. H₂: B₁ = B₂= B3 =B4 = 0 O Ho: One or more of the parameters is not equal to zero. H₂: B3 =B4 = 0 O Ho: B3 = P4 = 0 H₂: None of the parameters are equal to zero. ⒸH₁: B3 =B₁ = 0 H: One or more of the parameters is not equal to zero. O Ho: B₁ = P₂ = B3 =B4 = 0 H: One or more of the parameters is not equal to zero. ✔ Find…arrow_forwardThe table shows the amounts of crude oil (in thousands of barrels per day) produced by a certain country and the amounts of crude oil (in thousands of barrels per day) imported by the same country for seven years. The equation of the regression line is y =-1.364x+17,178.20. Complete parts (a) and (b) below. Produced, x Imported, y 5,744 5,554 5,439 5,188 5,136 5,067 D 9,132 9,677 10,017 10,193 10,149 10,075 5,756 9,328 (a) Find the coefficient of determination and interpret the result. (Round to three decimal places as needed.)arrow_forward
- The following table gives the data for the grades on the midterm exam and the grades on the final exam. Determine the equation of the regression line, y = bo + b₁x. Round the slope and y-intercept to the nearest thousandth. Grades on Midterm and Final Exams Grades on Midterm 66 68 71 86 78 85 62 82 79 61 Grades on Final 90 63 82 96 72 83 79 91 84 65arrow_forwardWhich of the following is true of a linear regression line? a. Located as close as possible to all the points of a scatter chart. B. Is defined by an equation having 2 parameters: the slope and the intercept c. Provides an approximate relationship between the values of two parameters d. All of the abovearrow_forward8arrow_forward
- a. Using the pairs of values for all 10 points, find the equation of the regression line. b. After removing the point with coordinates (2,3), use the pairs of values for the remaining 9 points and find the equation of the regression line. c. Compare the results from parts (a) and (b).arrow_forwardIn multiple regression, when all independent variables are considered but the order in which they are added to the model is determined by the amount it contributes to the dependent variable, it is called: a.Two step b.Stepwise c.Simultaneous d.Backward steparrow_forwardWhich of the multivariate regression parameters listed below would be best interpreted as: the proportion of variation in the dependent variable explain by all the independent variables in the model. a b1 X1 R2arrow_forward
arrow_back_ios
arrow_forward_ios
Recommended textbooks for you
- MATLAB: An Introduction with ApplicationsStatisticsISBN:9781119256830Author:Amos GilatPublisher:John Wiley & Sons Inc
 Probability and Statistics for Engineering and th...StatisticsISBN:9781305251809Author:Jay L. DevorePublisher:Cengage Learning
 Statistics for The Behavioral Sciences (MindTap C...StatisticsISBN:9781305504912Author:Frederick J Gravetter, Larry B. WallnauPublisher:Cengage Learning
  Elementary Statistics: Picturing the World (7th E...StatisticsISBN:9780134683416Author:Ron Larson, Betsy FarberPublisher:PEARSON
 The Basic Practice of StatisticsStatisticsISBN:9781319042578Author:David S. Moore, William I. Notz, Michael A. FlignerPublisher:W. H. Freeman
 Introduction to the Practice of StatisticsStatisticsISBN:9781319013387Author:David S. Moore, George P. McCabe, Bruce A. CraigPublisher:W. H. Freeman
MATLAB: An Introduction with Applications
Statistics
ISBN:9781119256830
Author:Amos Gilat
Publisher:John Wiley & Sons Inc
Probability and Statistics for Engineering and th...
Statistics
ISBN:9781305251809
Author:Jay L. Devore
Publisher:Cengage Learning
Statistics for The Behavioral Sciences (MindTap C...
Statistics
ISBN:9781305504912
Author:Frederick J Gravetter, Larry B. Wallnau
Publisher:Cengage Learning
Elementary Statistics: Picturing the World (7th E...
Statistics
ISBN:9780134683416
Author:Ron Larson, Betsy Farber
Publisher:PEARSON
The Basic Practice of Statistics
Statistics
ISBN:9781319042578
Author:David S. Moore, William I. Notz, Michael A. Fligner
Publisher:W. H. Freeman
Introduction to the Practice of Statistics
Statistics
ISBN:9781319013387
Author:David S. Moore, George P. McCabe, Bruce A. Craig
Publisher:W. H. Freeman