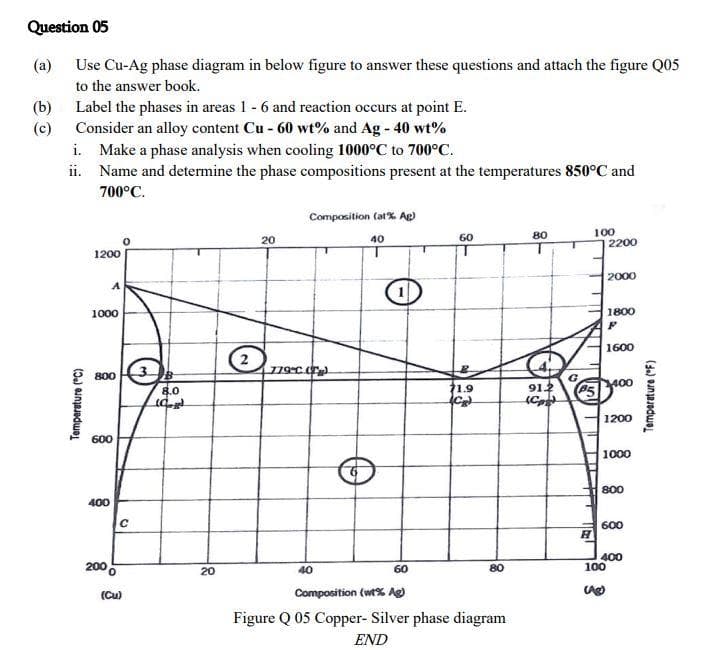
(a) Use Cu-Ag phase diagram in below figure to answer these questions and attach the figure Q05 to the answer book. (b) (c) Label the phases in areas 1 - 6 and reaction occurs at point E. Consider an alloy content Cu - 60 wt% and Ag - 40 wt% i. Make a phase analysis when cooling 1000°℃ to 700°C. ii. Name and determine the phase compositions present at the temperatures 850°C and 700°C.
(a) Use Cu-Ag phase diagram in below figure to answer these questions and attach the figure Q05 to the answer book. (b) (c) Label the phases in areas 1 - 6 and reaction occurs at point E. Consider an alloy content Cu - 60 wt% and Ag - 40 wt% i. Make a phase analysis when cooling 1000°℃ to 700°C. ii. Name and determine the phase compositions present at the temperatures 850°C and 700°C.

Principles of Instrumental Analysis
7th Edition
ISBN:9781305577213
Author:Douglas A. Skoog, F. James Holler, Stanley R. Crouch
Publisher:Douglas A. Skoog, F. James Holler, Stanley R. Crouch
Chapter23: Potentiometry
Section: Chapter Questions
Problem 23.12QAP: What arc the advantages of microfabricated ISEs? Describe typical applications of this type of...

Related questions
Question
1
Transcribed Image Text:Question 05
(a)
Use Cu-Ag phase diagram in below figure to answer these questions and attach the figure Q05
to the answer book.
(b)
(c)
Label the phases in areas 1 - 6 and reaction occurs at point E.
Consider an alloy content Cu - 60 wt% and Ag - 40 wt%
i. Make a phase analysis when cooling 1000°C to 700°C.
ii. Name and determine the phase compositions present at the temperatures 850°C and
700°C.
Temperature (°C)
1200
1000
800 3
600
400
2000
C
(Cu)
8.0
(g)
20
2
20
Composition (at% Ag)
779°C (T
40
40
60
71.9
1CB²
60
Composition (wt% Ag)
Figure Q 05 Copper- Silver phase diagram
END
80
80
91.2
C
100
85
1
E
H
2200
2000
1800
F
1600
400
1200
1000
800
100
(A)
600
400
Temperature (°F)
Expert Solution
This question has been solved!
Explore an expertly crafted, step-by-step solution for a thorough understanding of key concepts.

Step by step
Solved in 8 steps with 4 images

Knowledge Booster


Learn more about
Need a deep-dive on the concept behind this application? Look no further. Learn more about this topic, chemistry and related others by exploring similar questions and additional content below.Recommended textbooks for you
Principles of Instrumental Analysis
Chemistry
ISBN:
9781305577213
Author:
Douglas A. Skoog, F. James Holler, Stanley R. Crouch
Publisher:
Cengage Learning
Principles of Instrumental Analysis
Chemistry
ISBN:
9781305577213
Author:
Douglas A. Skoog, F. James Holler, Stanley R. Crouch
Publisher:
Cengage Learning