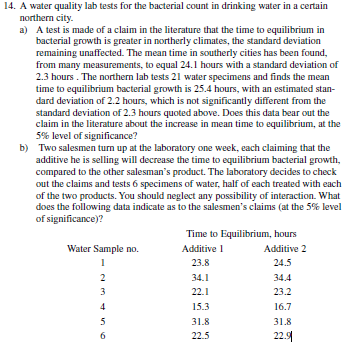
A water quality lab tests for the bacterial count in drinking water in a certain northern city. a) A test is made of a claim in the literature that the time to equilibrium in bacterial growth is greater in northerly climates, the standard deviation remaining unaffected. The mean time in southerly cities has been found, from many measurements, to equal 24.1 hours with a standard deviation of 2.3 hours. The northern lab tests 21 water specimens and finds the mean time to equilibrium bacterial growth is 25.4 hours, with an estimated stan- dard deviation of 2.2 hours, which is not significantly different from the standard deviation of 2.3 hours quoted above. Does this data bear out the claim in the literature about the increase in mean time to equilibrium, at the 5% level of significance? b) Two salesmen turn up at the laboratory one week, each claiming that the additive he is selling will decrease the time to equilibrium bacterial growth, compared to the other salesman's product. The laboratory decides to check out the claims and tests 6 specimens of water, half of each treated with each of the two products. You should neglect any possibility of interaction. What does the following data indicate as to the salesmen's claims (at the 5% level of significance)? Time to Equilibrium, hours Water Sample no. Additive I Additive 2 23.8 24.5 34.1 34.4 22.1 23.2 15.3 16.7 31.8 31.8 22.5 22.4
A water quality lab tests for the bacterial count in drinking water in a certain northern city. a) A test is made of a claim in the literature that the time to equilibrium in bacterial growth is greater in northerly climates, the standard deviation remaining unaffected. The mean time in southerly cities has been found, from many measurements, to equal 24.1 hours with a standard deviation of 2.3 hours. The northern lab tests 21 water specimens and finds the mean time to equilibrium bacterial growth is 25.4 hours, with an estimated stan- dard deviation of 2.2 hours, which is not significantly different from the standard deviation of 2.3 hours quoted above. Does this data bear out the claim in the literature about the increase in mean time to equilibrium, at the 5% level of significance? b) Two salesmen turn up at the laboratory one week, each claiming that the additive he is selling will decrease the time to equilibrium bacterial growth, compared to the other salesman's product. The laboratory decides to check out the claims and tests 6 specimens of water, half of each treated with each of the two products. You should neglect any possibility of interaction. What does the following data indicate as to the salesmen's claims (at the 5% level of significance)? Time to Equilibrium, hours Water Sample no. Additive I Additive 2 23.8 24.5 34.1 34.4 22.1 23.2 15.3 16.7 31.8 31.8 22.5 22.4

MATLAB: An Introduction with Applications
6th Edition
ISBN:9781119256830
Author:Amos Gilat
Publisher:Amos Gilat
Chapter1: Starting With Matlab
Section: Chapter Questions
Problem 1P

Related questions
Topic Video
Question
Transcribed Image Text:14. A water quality lab tests for the bacterial count in drinking water in a certain
northern city.
a) A test is made of a claim in the literature that the time to equilibrium in
bacterial growth is greater in northerly climates, the standard deviation
remaining unaffected. The mean time in southerly cities has been found,
from many measurements, to equal 24.1 hours with a standard deviation of
2.3 hours. The northern lab tests 21 water specimens and finds the mean
time to equilibrium bacterial growth is 25.4 hours, with an estimated stan-
dard deviation of 2.2 hours, which is not significantly different from the
standard deviation of 2.3 hours quoted above. Does this data bear out the
claim in the literature about the increase in mean time to equilibrium, at the
5% level of significance?
b) Two salesmen turn up at the laboratory one week, each claiming that the
additive he is selling will decrease the time to equilibrium bacterial growth,
compared to the other salesman's product. The laboratory decides to check
out the claims and tests 6 specimens of water, half of each treated with each
of the two products. You should neglect any possibility of interaction. What
does the following data indicate as to the salesmen's claims (at the 5% level
of significance)?
Time to Equilibrium, hours
Water Sample no.
Additive 1
Additive 2
23.8
24.5
34.1
34.4
3
22.1
23.2
4
15.3
16.7
31.8
31.8
22.
6.
22.5
Expert Solution
This question has been solved!
Explore an expertly crafted, step-by-step solution for a thorough understanding of key concepts.

Step by step
Solved in 3 steps

Knowledge Booster


Learn more about
Need a deep-dive on the concept behind this application? Look no further. Learn more about this topic, statistics and related others by exploring similar questions and additional content below.Recommended textbooks for you
MATLAB: An Introduction with Applications
Statistics
ISBN:
9781119256830
Author:
Amos Gilat
Publisher:
John Wiley & Sons Inc

Probability and Statistics for Engineering and th…
Statistics
ISBN:
9781305251809
Author:
Jay L. Devore
Publisher:
Cengage Learning

Statistics for The Behavioral Sciences (MindTap C…
Statistics
ISBN:
9781305504912
Author:
Frederick J Gravetter, Larry B. Wallnau
Publisher:
Cengage Learning
MATLAB: An Introduction with Applications
Statistics
ISBN:
9781119256830
Author:
Amos Gilat
Publisher:
John Wiley & Sons Inc
Probability and Statistics for Engineering and th…
Statistics
ISBN:
9781305251809
Author:
Jay L. Devore
Publisher:
Cengage Learning
Statistics for The Behavioral Sciences (MindTap C…
Statistics
ISBN:
9781305504912
Author:
Frederick J Gravetter, Larry B. Wallnau
Publisher:
Cengage Learning

Elementary Statistics: Picturing the World (7th E…
Statistics
ISBN:
9780134683416
Author:
Ron Larson, Betsy Farber
Publisher:
PEARSON

The Basic Practice of Statistics
Statistics
ISBN:
9781319042578
Author:
David S. Moore, William I. Notz, Michael A. Fligner
Publisher:
W. H. Freeman

Introduction to the Practice of Statistics
Statistics
ISBN:
9781319013387
Author:
David S. Moore, George P. McCabe, Bruce A. Craig
Publisher:
W. H. Freeman