a. Attach the summary output of the excel. b. Using Excel, develop the multiple regression equation for these data. (Answer should be handwritten). c. What is the coefficient of determination for this
a. Attach the summary output of the excel. b. Using Excel, develop the multiple regression equation for these data. (Answer should be handwritten). c. What is the coefficient of determination for this

Glencoe Algebra 1, Student Edition, 9780079039897, 0079039898, 2018
18th Edition
ISBN:9780079039897
Author:Carter
Publisher:Carter
Chapter10: Statistics
Section10.6: Summarizing Categorical Data
Problem 25PPS

Related questions
Question
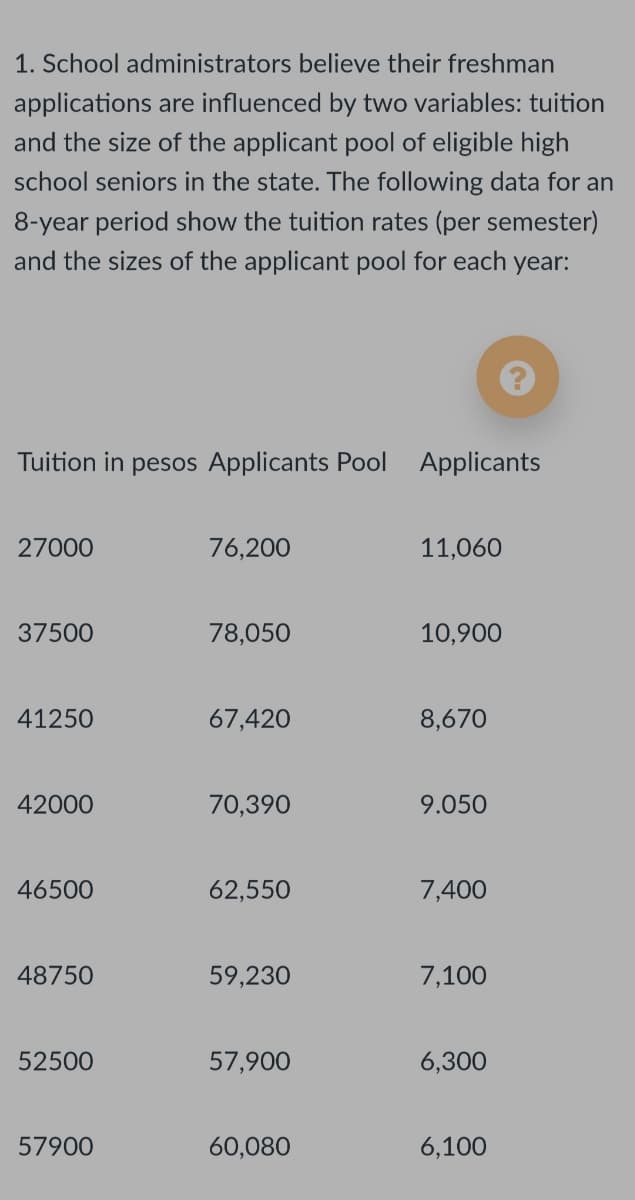
Transcribed Image Text:1. School administrators believe their freshman
applications are influenced by two variables: tuition
and the size of the applicant pool of eligible high
school seniors in the state. The following data for an
8-year period show the tuition rates (per semester)
and the sizes of the applicant pool for each year:
Tuition in pesos Applicants Pool Applicants
27000
76,200
11,060
37500
78,050
10,900
41250
67,420
8,670
42000
70,390
9.050
46500
62,550
7,400
48750
59,230
7,100
52500
57,900
6,300
57900
60,080
6,100
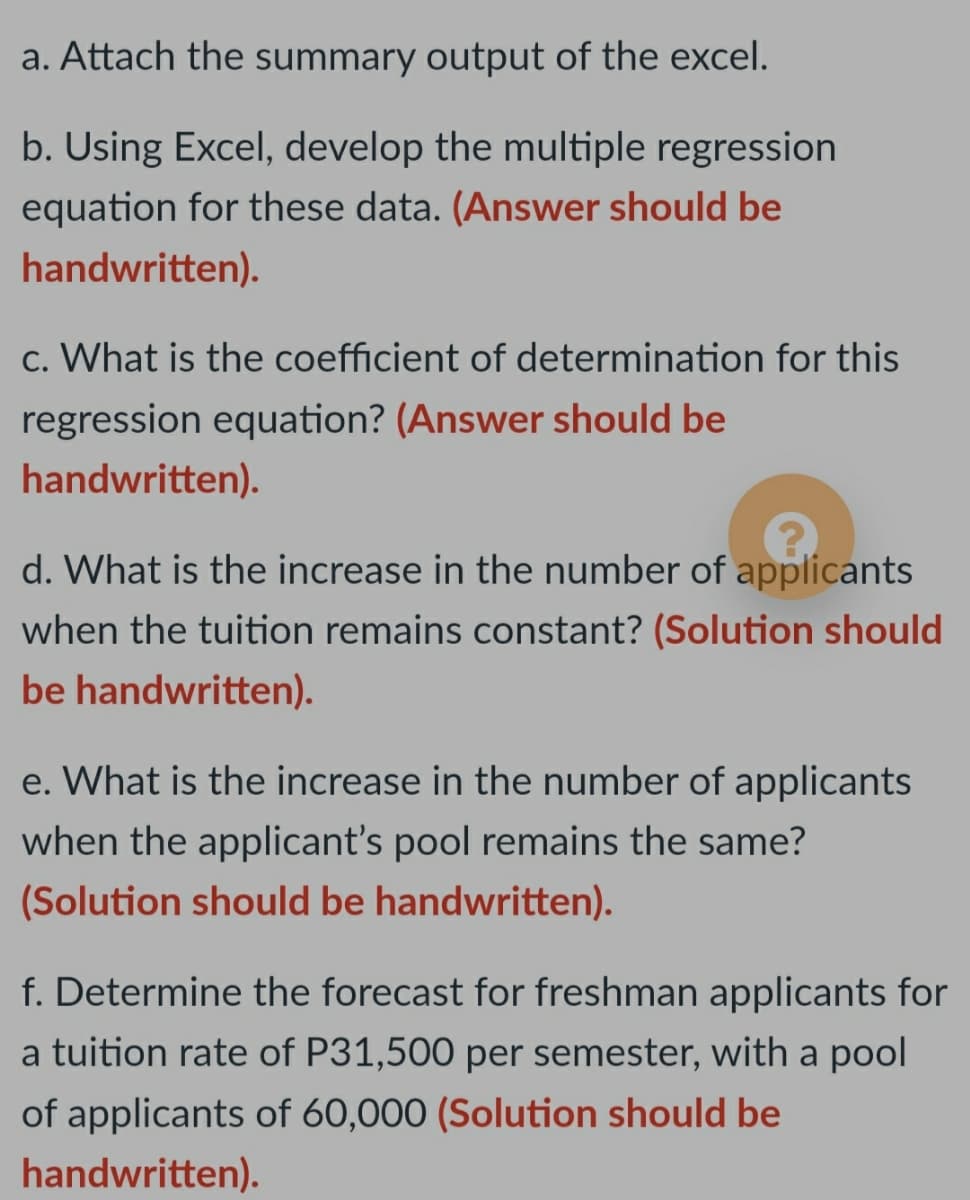
Transcribed Image Text:a. Attach the summary output of the excel.
b. Using Excel, develop the multiple regression
equation for these data. (Answer should be
handwritten).
c. What is the coefficient of determination for this
regression equation? (Answer should be
handwritten).
d. What is the increase in the number of applicants
when the tuition remains constant? (Solution should
be handwritten).
e. What is the increase in the number of applicants
when the applicant's pool remains the same?
(Solution should be handwritten).
f. Determine the forecast for freshman applicants for
a tuition rate of P31,500 per semester, with a pool
of applicants of 60,000 (Solution should be
handwritten).
Expert Solution
This question has been solved!
Explore an expertly crafted, step-by-step solution for a thorough understanding of key concepts.

Step by step
Solved in 7 steps

Recommended textbooks for you
Glencoe Algebra 1, Student Edition, 9780079039897…
Algebra
ISBN:
9780079039897
Author:
Carter
Publisher:
McGraw Hill
Glencoe Algebra 1, Student Edition, 9780079039897…
Algebra
ISBN:
9780079039897
Author:
Carter
Publisher:
McGraw Hill