The following estimated regression equation based on 30 observations was presented. ŷ = 17.6 + 3.8x, - 2.3x2 + 7.6x3 + 2.7x4 The values of SST and SSR are 1,809 and 1,757, respectively.
The following estimated regression equation based on 30 observations was presented. ŷ = 17.6 + 3.8x, - 2.3x2 + 7.6x3 + 2.7x4 The values of SST and SSR are 1,809 and 1,757, respectively.

College Algebra
7th Edition
ISBN:9781305115545
Author:James Stewart, Lothar Redlin, Saleem Watson
Publisher:James Stewart, Lothar Redlin, Saleem Watson
Chapter1: Equations And Graphs
Section: Chapter Questions
Problem 10T: Olympic Pole Vault The graph in Figure 7 indicates that in recent years the winning Olympic men’s...

Related questions
Question
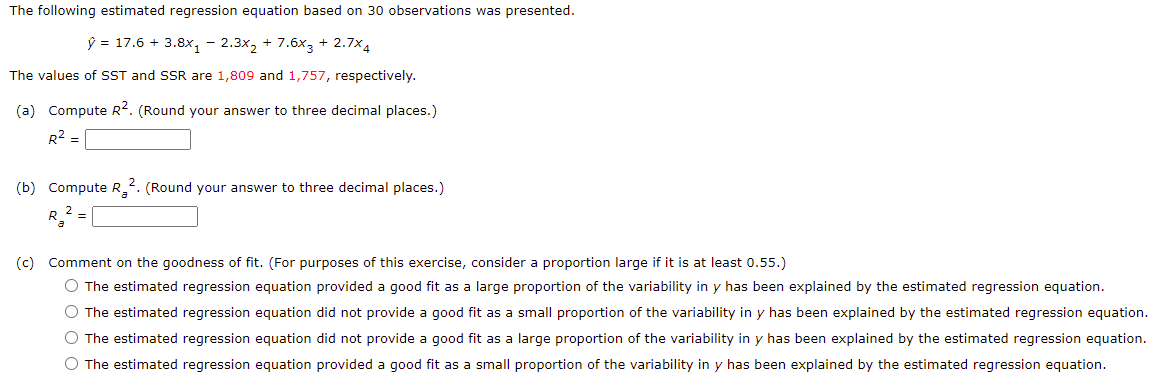
Transcribed Image Text:The following estimated regression equation based on 30 observations was presented.
ý = 17.6 + 3.8x, - 2.3x, + 7.6x3 + 2.7x4
The values of SST and SSR are 1,809 and 1,757, respectively.
(a) Compute R. (Round your answer to three decimal places.)
R2 =
(b) Compute R_2. (Round your answer to three decimal places.)
(c) Comment on the goodness of fit. (For purposes of this exercise, consider a proportion large if it is at least 0.55.)
O The estimated regression equation provided a good fit as a large proportion of the variability in y has been explained by the estimated regression equation.
O The estimated regression equation did not provide a good fit as a small proportion of the variability in y has been explained by the estimated regression equation.
O The estimated regression equation did not provide a good fit as a large proportion of the variability in y has been explained by the estimated regression equation.
O The estimated regression equation provided a good fit as a small proportion of the variability in y has been explained by the estimated regression equation.
Expert Solution
This question has been solved!
Explore an expertly crafted, step-by-step solution for a thorough understanding of key concepts.

This is a popular solution!

Trending now
This is a popular solution!

Step by step
Solved in 3 steps with 2 images

Recommended textbooks for you
College Algebra
Algebra
ISBN:
9781305115545
Author:
James Stewart, Lothar Redlin, Saleem Watson
Publisher:
Cengage Learning
College Algebra
Algebra
ISBN:
9781305115545
Author:
James Stewart, Lothar Redlin, Saleem Watson
Publisher:
Cengage Learning