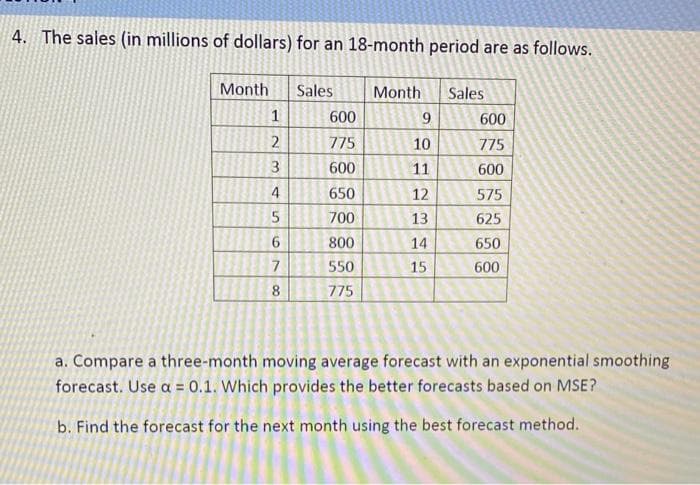
a. Compare a three-month moving average forecast with an exponential smoothing forecast. Use a = .1. Which provides the better forecasts based on MSE? b. Find the forecast for the next month using the best forecast method.


Q: Use a three-period weighted-moving average forecast to determine a forecast for the 8th week using…
A: THE ANSWER IS AS BELOW:
Q: The company Handy Inc. produces a solar-powered electronic calculator that has experienced the…
A: 1) From the data given :-a) Moving average with N=3 forecast is given as :- Ft=Dt-1+Dt-2+Dt-33…
Q: hat are the benefits of exponential smoothing as a forecasting method over running averages
A: The advantages of the exponential smoothing over moving averages with respect to the forecasting…
Q: Discuss the basic assumptions made when using time series forecasting techniques as opposed to…
A: Several assumptions are made during the Time Series Initial Phase.
Q: 10. What is the approximate forecast for May using a four-month moving average? a.38 b.43 c.44 d. 47
A: Given data is
Q: 2. The department manager using a combination of methods has forecast sales of toasters at a local…
A: Below is the solution:-
Q: Using the data set below, what would be the forecast for period 5 using the exponential smoothing…
A: Forecasting is the process of estimating future sales or demand using previous data and information.…
Q: 17. Statistical and observational methods, where adequate data or settings are available in which to…
A: Forecasting: It means the prediction of the future period. The prediction will be done based on the…
Q: a) Plot the monthly sales data. b) Forecast January sales using each of the following: i) Naive…
A: Forecasting is a technique that uses historical data as information to make informed assessments…
Q: Explain the basic assumptions made when using time series forecasting techniques as opposed to…
A: The Time Series Initial Phase makes a variety of assumptions.
Q: The Yummy Ice Cream Company uses the exponential smoothing method. Last week the forecast was…
A:
Q: Compute a 3-month weighted average forecast for months 4 through 9. Assign weights of 0.55, 0.33 and…
A: Forecasting is a technique used to predict future outcomes on the basis of past data. There are…
Q: Use exponential smoothing with a=0.2 and a=0.5 to generate forecasts for periods 2 through 6. Use…
A:
Q: a. Forecast the sales for the month of July using a 3-week moving average b. Forecast the sales for…
A: Since you have posted a question with multiple sub-parts, we will solve the first three subparts for…
Q: Develop a 3-weck weighted average forecast for Week 4 through 9 with weights WI - W2 = W3 = 0.2 0.3…
A: A moving average based on weighted average puts weight on the data gathered recently, by multiplying…
Q: a) Forecast the demand for the week of October 12 using a 3-week moving average. b) Use a 3-week…
A: Forecasting is the process of estimating the future demand according to previous or historic…
Q: a. Compute a three-semester moving average forecast for semesters 4 through 9. b. Compute the…
A: Formula for three-semester moving average: Fn+1 = (An + An-1 + An-2)/3 where F = ForecastA =…
Q: Calculate the forecast for Week 16 using - a 2-period moving average - a 3-period moving average…
A: Given data is
Q: ii. The last seven weeks of sales at KC car dealership can be seen in Table 2 below. Table 2 Week…
A: Week Sales 1 25 2 30 3 27 4 31 5 27 6 29 7 30 8
Q: At the ABC Floral Shop, an argument developed between two of the owners, Bob and Henry, over the…
A: A simple exponential smoothing method is used for smoothing time series data by assigning…
Q: The accompanying dataset provides data on the monthly usage of natural gas (in millions of cubic…
A: Given data is Alpha = 0.6 Gamma = 0.8
Q: What is the definition of a forecast error?a. The average difference between the forecast and the…
A: Forecasting is a tool that uses historical data as inputs that are predictive in deciding the path…
Q: 4. What is the forecast for the 13th period based on the four-period moving average? Round your…
A: Given data is
Q: State the assumptions made when using a time series forecasting techniques
A: Numerous estimates are taken in statistical analysis.
Q: Marianne Schwartz, the owner of Handy Man Rentals, rents carpet cleaners to contractors and walk-in…
A:
Q: Types of Forecasts that might be needed in IKEA
A: Let’s first understand the meaning of Forecasting and types of Forecasting. Forecasting can be…
Q: our manager is trying to determine what forecasting method to use. Based upon the following…
A: first we put the value on excel sheet then applying weighted moving average formula which shown in…
Q: a) Using a weighted 3-month moving average with weights of 0.60, 0.30, and 0.10, Find the July…
A: Forecasting is a technique used to predict future outcomes on the basis of past data. In businesses…
Q: Your manager is trying to determine what forecasting method to use. Based upon the following…
A: In exponential smoothing, the smoothing constant is used to forecast the demand for the next period…
Q: Consider the following forecasting model: x^t,t+1=axt+(1-a)x^t-1,t If a decreases from 0.5 to 0.2,…
A: The given question is about exponential smoothing.
Q: a. Forecast April through September using a three-month moving average. b. Use simple exponential…
A: Below is the solution:-
Q: snip
A: A moving average forecast becomes less responsive to change in a data series when more data points…
Q: Consider the following time series data. Choose the correct time series plot. (i) (ii)…
A: A time series is a grouping of information focuses that happen in progressive requests throughout…
Q: onsider the following time series data. Week 1 2 3 4 5 6 Value 18 12 15 11 18 13 Using the…
A: Given that: Week Value 1 18 2 12 3 15 4 11 5 18 6 13
Q: (3) A weighted average using.60 for August, .30 for July, and .10 for June (4) Exponential smoothing…
A: Forecasting is the process of prediction in which sales demand is estimated using historic…
Q: A check-processing center uses exponential smoothing to forecast the number of incoming checks each…
A: The forecasting technique is used to make predictions based on past and present data. Use in the…
Q: . What is the mean square error for time periods 2 through 4 using the average forecasting method?…
A: I am using the 2 periods simple moving average method to find average forecasts. It is the average…
Q: Discuss the basic assumptions made when using time series forecasting techniques as apposed to…
A: Time series forecasting fundamental assumptions:
Q: Why the following Approaches are used in forecasting, how would you interpret them what do they mean…
A: Forecasting is a technique that a marketer uses to estimate various things like a trend, future…
Q: 9 438 18 482 a. Explain why an averaging technique would not be appropriate for forecasting. b. Use…
A: Forecasting is an important part of any business. It helps to predict future demand and production…
Q: Use a three-period moving average method to determine forecast value for time 5 to 7. Use an…
A: THE ANSWER IS AS BELOW:
Q: A)- Explain the calculation method for the Naive Forecast model. B) If at the end of every month…
A: Forecasting the values in advance helps to reduce the cost, and increase profits by reducing wastage…
Q: b) Use a 3-week weighted moving average, with weights of.1, .3, and .6, using.6 for the most recent…
A: Forecasting is the process of determining the estimated future demand using historical information…
Q: a. Compare a three-month moving average forecast with an exponential smoothing forecast. Use a =…
A: Below is the solution:-
Q: In the text, the example of Walmart's collaboration with Sara Lee during hurricane season enables…
A: Demand forecasting is the method involved with utilizing prescient investigation of verifiable…
Q: a. Calculate the simple three-month moving average forecast for periods 4 to 12.
A: Since you have asked multiple questions, we will solve the first question for you. If you want any…
Q: b) The forecast for the next month (Jan) using the naive method= 22 sales (round your response to a…
A: Forecasting is the process of predicting future events or trends based on past and present data.…


Trending now
This is a popular solution!

Step by step
Solved in 2 steps with 17 images

- The file P13_42.xlsx contains monthly data on consumer revolving credit (in millions of dollars) through credit unions. a. Use these data to forecast consumer revolving credit through credit unions for the next 12 months. Do it in two ways. First, fit an exponential trend to the series. Second, use Holts method with optimized smoothing constants. b. Which of these two methods appears to provide the best forecasts? Answer by comparing their MAPE values.The Baker Company wants to develop a budget to predict how overhead costs vary with activity levels. Management is trying to decide whether direct labor hours (DLH) or units produced is the better measure of activity for the firm. Monthly data for the preceding 24 months appear in the file P13_40.xlsx. Use regression analysis to determine which measure, DLH or Units (or both), should be used for the budget. How would the regression equation be used to obtain the budget for the firms overhead costs?The file P13_28.xlsx contains monthly retail sales of U.S. liquor stores. a. Is seasonality present in these data? If so, characterize the seasonality pattern. b. Use Winters method to forecast this series with smoothing constants = = 0.1 and = 0.3. Does the forecast series seem to track the seasonal pattern well? What are your forecasts for the next 12 months?
- The file P13_29.xlsx contains monthly time series data for total U.S. retail sales of building materials (which includes retail sales of building materials, hardware and garden supply stores, and mobile home dealers). a. Is seasonality present in these data? If so, characterize the seasonality pattern. b. Use Winters method to forecast this series with smoothing constants = = 0.1 and = 0.3. Does the forecast series seem to track the seasonal pattern well? What are your forecasts for the next 12 months?The file P13_26.xlsx contains the monthly number of airline tickets sold by the CareFree Travel Agency. a. Create a time series chart of the data. Based on what you see, which of the exponential smoothing models do you think will provide the best forecasting model? Why? b. Use simple exponential smoothing to forecast these data, using a smoothing constant of 0.1. c. Repeat part b, but search for the smoothing constant that makes RMSE as small as possible. Does it make much of an improvement over the model in part b?The file P13_22.xlsx contains total monthly U.S. retail sales data. While holding out the final six months of observations for validation purposes, use the method of moving averages with a carefully chosen span to forecast U.S. retail sales in the next year. Comment on the performance of your model. What makes this time series more challenging to forecast?
- The file P13_02.xlsx contains five years of monthly data on sales (number of units sold) for a particular company. The company suspects that except for random noise, its sales are growing by a constant percentage each month and will continue to do so for at least the near future. a. Explain briefly whether the plot of the series visually supports the companys suspicion. b. By what percentage are sales increasing each month? c. What is the MAPE for the forecast model in part b? In words, what does it measure? Considering its magnitude, does the model seem to be doing a good job? d. In words, how does the model make forecasts for future months? Specifically, given the forecast value for the last month in the data set, what simple arithmetic could you use to obtain forecasts for the next few months?The owner of a restaurant in Bloomington, Indiana, has recorded sales data for the past 19 years. He has also recorded data on potentially relevant variables. The data are listed in the file P13_17.xlsx. a. Estimate a simple regression equation involving annual sales (the dependent variable) and the size of the population residing within 10 miles of the restaurant (the explanatory variable). Interpret R-square for this regression. b. Add another explanatory variableannual advertising expendituresto the regression equation in part a. Estimate and interpret this expanded equation. How does the R-square value for this multiple regression equation compare to that of the simple regression equation estimated in part a? Explain any difference between the two R-square values. How can you use the adjusted R-squares for a comparison of the two equations? c. Add one more explanatory variable to the multiple regression equation estimated in part b. In particular, estimate and interpret the coefficients of a multiple regression equation that includes the previous years advertising expenditure. How does the inclusion of this third explanatory variable affect the R-square, compared to the corresponding values for the equation of part b? Explain any changes in this value. What does the adjusted R-square for the new equation tell you?The file P13_25.xlsx contains the quarterly numbers of applications for home mortgage loans at a branch office of Northern Central Bank. a. Create a time series chart of the data. Based on what you see, which of the exponential smoothing models do you think will provide the best forecasting model? Why? b. Use simple exponential smoothing to forecast these data, using a smoothing constant of 0.1. c. Repeat part b, but search for the smoothing constant that makes RMSE as small as possible. Does it make much of an improvement over the model in part b? Is it guaranteed to produce better forecasts for the future?
- A small computer chip manufacturer wants to forecast monthly ozperating costs as a function of the number of units produced during a month. The company has collected the 16 months of data in the file P13_34.xlsx. a. Determine an equation that can be used to predict monthly production costs from units produced. Are there any outliers? b. How could the regression line obtained in part a be used to determine whether the company was efficient or inefficient during any particular month?Suppose that a regional express delivery service company wants to estimate the cost of shipping a package (Y) as a function of cargo type, where cargo type includes the following possibilities: fragile, semifragile, and durable. Costs for 15 randomly chosen packages of approximately the same weight and same distance shipped, but of different cargo types, are provided in the file P13_16.xlsx. a. Estimate a regression equation using the given sample data, and interpret the estimated regression coefficients. b. According to the estimated regression equation, which cargo type is the most costly to ship? Which cargo type is the least costly to ship? c. How well does the estimated equation fit the given sample data? How might the fit be improved? d. Given the estimated regression equation, predict the cost of shipping a package with semifragile cargo.Under what conditions might a firm use multiple forecasting methods?

