a. Construct a relative frequency distribution table for this data. b. What proportion of employees has daily commute time less than 30 minutes? c. Calculate the modal daily commute time for this sample of employees. Show work for full points.
a. Construct a relative frequency distribution table for this data. b. What proportion of employees has daily commute time less than 30 minutes? c. Calculate the modal daily commute time for this sample of employees. Show work for full points.

Glencoe Algebra 1, Student Edition, 9780079039897, 0079039898, 2018
18th Edition
ISBN:9780079039897
Author:Carter
Publisher:Carter
Chapter10: Statistics
Section10.4: Distributions Of Data
Problem 19PFA

Related questions
Question
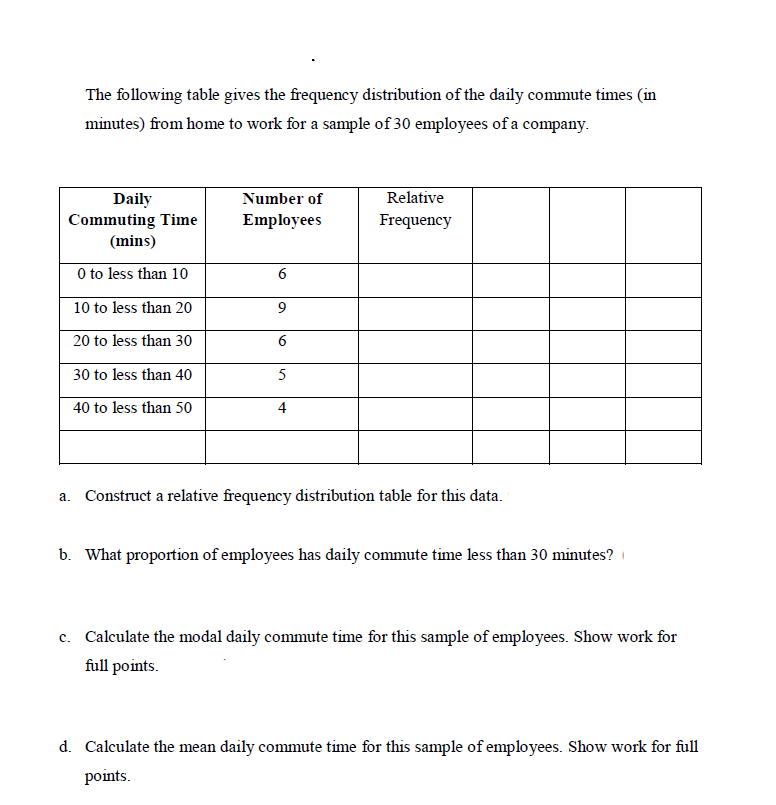
Transcribed Image Text:The following table gives the frequency distribution of the daily commute times (in
minutes) from home to work for a sample of 30 employees of a company.
Relative
Daily
Commuting Time
(mins)
Number of
Employees
Frequency
O to less than 10
10 to less than 20
9
20 to less than 30
30 to less than 40
5
40 to less than 50
4
a. Construct a relative frequency distribution table for this data.
b. What proportion of employees has daily commute time less than 30 minutes?
c. Calculate the modal daily commute time for this sample of employees. Show work for
full points.
d. Calculate the mean daily commute time for this sample of employees. Show work for full
points.
6.
Expert Solution
This question has been solved!
Explore an expertly crafted, step-by-step solution for a thorough understanding of key concepts.

Step by step
Solved in 2 steps

Recommended textbooks for you
Glencoe Algebra 1, Student Edition, 9780079039897…
Algebra
ISBN:
9780079039897
Author:
Carter
Publisher:
McGraw Hill
Glencoe Algebra 1, Student Edition, 9780079039897…
Algebra
ISBN:
9780079039897
Author:
Carter
Publisher:
McGraw Hill