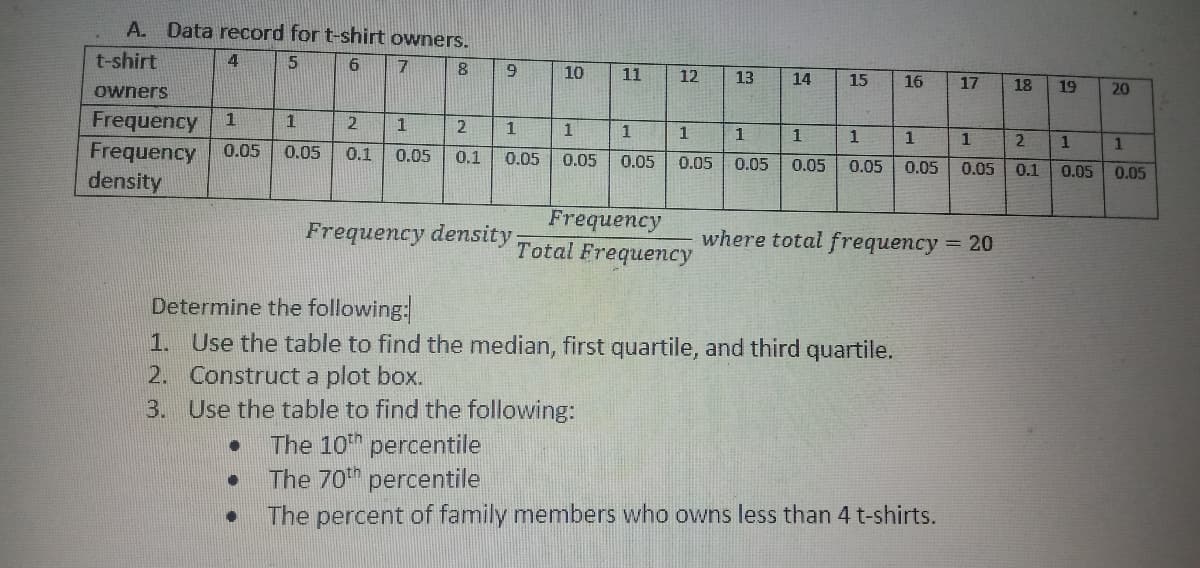
A. Data record for t-shirt owners. t-shirt 5 6. 8 10 11 12 13 14 15 16 17 18 19 owners 20 Frequency Frequency density 1 1 1 1 1 1 2 1 0.05 0.05 0.1 0.05 0.1 0.05 0.05 0.05 0.05 0.05 0.05 0.05 0.05 0.05 0.1 0.05 0.05 Frequency Frequency density: where total frequency 20 Total Frequency Determine the following: 1. Use the table to find the median, first quartile, and third quartile. 2. Construct a plot box. 3. Use the table to find the following: The 10th percentile The 70th percentile The percent of family members who owns less than 4 t-shirts.
A. Data record for t-shirt owners. t-shirt 5 6. 8 10 11 12 13 14 15 16 17 18 19 owners 20 Frequency Frequency density 1 1 1 1 1 1 2 1 0.05 0.05 0.1 0.05 0.1 0.05 0.05 0.05 0.05 0.05 0.05 0.05 0.05 0.05 0.1 0.05 0.05 Frequency Frequency density: where total frequency 20 Total Frequency Determine the following: 1. Use the table to find the median, first quartile, and third quartile. 2. Construct a plot box. 3. Use the table to find the following: The 10th percentile The 70th percentile The percent of family members who owns less than 4 t-shirts.

Mathematics For Machine Technology
8th Edition
ISBN:9781337798310
Author:Peterson, John.
Publisher:Peterson, John.
Chapter29: Tolerance, Clearance, And Interference
Section: Chapter Questions
Problem 16A: Spacers are manufactured to the mean dimension and tolerance shown in Figure 29-12. An inspector...

Related questions

Question
100%
Transcribed Image Text:A. Data record for t-shirt owners.
t-shirt
6
8
9.
10
11
12
13
14
15
16
17
18
19
20
owners
Frequency
Frequency
density
1
1
1
2.
1
1
0.05
0.05
0.1
0.05
0.1
0.05
0.05
0.05
0.05
0.05
0.05
0.05
0.05
0.05
0.1
0.05
0.05
Frequency
Total Erequency
Frequency density:
where total frequency = 20
Determine the following:
1. Use the table to find the median, first quartile, and third quartile.
2. Construct a plot box.
3. Use the table to find the following:
The 10th percentile
The 70th percentile
The percent of family members who owns less than 4 t-shirts.
1,
Expert Solution
This question has been solved!
Explore an expertly crafted, step-by-step solution for a thorough understanding of key concepts.

This is a popular solution!

Trending now
This is a popular solution!

Step by step
Solved in 4 steps with 1 images

Knowledge Booster


Learn more about
Need a deep-dive on the concept behind this application? Look no further. Learn more about this topic, statistics and related others by exploring similar questions and additional content below.Recommended textbooks for you
Mathematics For Machine Technology
Advanced Math
ISBN:
9781337798310
Author:
Peterson, John.
Publisher:
Cengage Learning,
Mathematics For Machine Technology
Advanced Math
ISBN:
9781337798310
Author:
Peterson, John.
Publisher:
Cengage Learning,