1. A histogram of the distribution of salaries of non-administrative personnel of a company is given in the figure below. 0.28 0.26 0.24 0.22 0.2 0.18 Relative 0.16 0.14 Frequency 0.12 0.1 0.08 0.06 0.04 0.02 20 21 22 23 24 25 26 27 28 29 30 Salary (in Thousands of Dollars) a. What percent of the salaries are between $23,500 and $24,500? b. What percent of salaries exceed $ 26,500? c. Assuming the histograms is based on 400 people, construct the frequency distribution that corresponds to this histogram. d. Again, assuming 400 people, how many employees had salaries between $25,500 and $26,500?
1. A histogram of the distribution of salaries of non-administrative personnel of a company is given in the figure below. 0.28 0.26 0.24 0.22 0.2 0.18 Relative 0.16 0.14 Frequency 0.12 0.1 0.08 0.06 0.04 0.02 20 21 22 23 24 25 26 27 28 29 30 Salary (in Thousands of Dollars) a. What percent of the salaries are between $23,500 and $24,500? b. What percent of salaries exceed $ 26,500? c. Assuming the histograms is based on 400 people, construct the frequency distribution that corresponds to this histogram. d. Again, assuming 400 people, how many employees had salaries between $25,500 and $26,500?

Glencoe Algebra 1, Student Edition, 9780079039897, 0079039898, 2018
18th Edition
ISBN:9780079039897
Author:Carter
Publisher:Carter
Chapter10: Statistics
Section10.1: Measures Of Center
Problem 9PPS

Related questions
Question
Hi i kindly need help please help me solve the problem thank you
Transcribed Image Text:EDFN 3520
Assignment #2
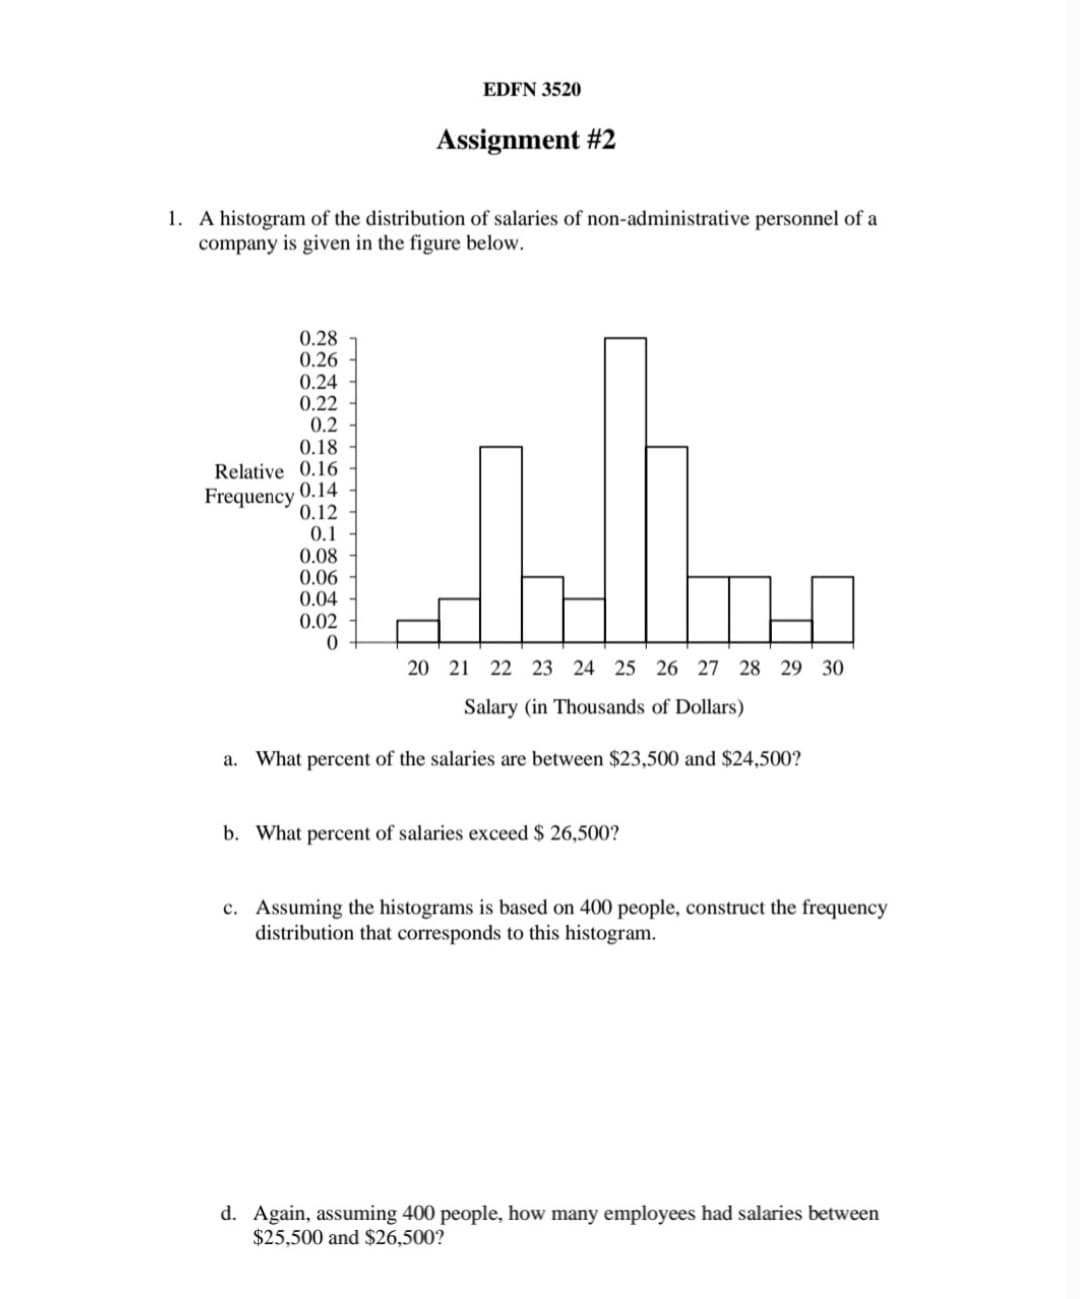
1. A histogram of the distribution of salaries of non-administrative personnel of a
company is given in the figure below.
0.28
0.26
0.24
0.22
0.2
0.18
Relative 0.16
0.14
Frequency
0.12
0.1
0.08
0.06
0.04
0.02
20 21 22 23 24 25 26 27 28 29 30
Salary (in Thousands of Dollars)
а.
What percent of the salaries are between $23,500 and $24,500?
b. What percent of salaries exceed $ 26,500?
c. Assuming the histograms is based on 400 people, construct the frequency
distribution that corresponds to this histogram.
d. Again, assuming 400 people, how many employees had salaries between
$25,500 and $26,500?
TTT TTT TTT TT
Expert Solution
This question has been solved!
Explore an expertly crafted, step-by-step solution for a thorough understanding of key concepts.

This is a popular solution!

Trending now
This is a popular solution!

Step by step
Solved in 3 steps with 4 images

Recommended textbooks for you
Glencoe Algebra 1, Student Edition, 9780079039897…
Algebra
ISBN:
9780079039897
Author:
Carter
Publisher:
McGraw Hill
Glencoe Algebra 1, Student Edition, 9780079039897…
Algebra
ISBN:
9780079039897
Author:
Carter
Publisher:
McGraw Hill