a. Fill the following table and provide evident that you ask 6 students. ent # 1 2 3 4 4 2 2.5 1.5 b. Calculate all central tendency measurements of the time. c. Calculate all dispersion measurements of the time.


Q: A researcher studies water clarity at the same location in a lake on the same dates during the…
A:
Q: 6) Use table 2 to answer the following questions: Image distance (mm) 146 174 170 165 175 167 163…
A: “Since you have posted a question with multiple sub-parts, we will solve first three subparts for…
Q: Complete the given relative frequency distribution. Outcome 2 3 4 Rel. Frequency 0.4 0.1 0.1 0.3…
A: Property of probablity ∑i=1nP(Yi)=1
Q: Which of the following graphs is not useful for displaying the distribution of the data? Box plot…
A: We have to find correct answer for question.....
Q: 4. Consider the below data set: 65 87 x 75| 80 93 82 78 | 86 68 84 77 72 89 71 98 y 72 91 80 95 74…
A: Given: The data set: - x y 75 82 80 78 93 86 65 72 87 91 71 80 98 95 68 72 84…
Q: a. Given the following frequency distributions, fill in the missing frequencies and calculate the…
A: Given, Class Interval Frequency Cumulative Frequency 10-20 5 5 20-30 10 15 30-40 12…
Q: Consider the following ordered data. 2 5 5 6 7 7 8 9 10 (a) Find the low, Q1,…
A: a.)The sorted data set is 2,5,5,6,7,7,8,9,10.The lowest value and the highest values are 2 and 10…
Q: H.w1: from the following table draw: 1) Histogram -diagram 2) Frequency polygon 3) Frequency curve…
A: Given: Class Frequency 8- 10 12- 20 16- 40 20- 50 24-28 30
Q: 1. Complete the frequency distribution table. TIME (in f X hours) 9-10 7-8 5-6 3-4 1-2 LB <cfb
A: Given frequency is 1 1 1 2 2 2 3 3 3 4 5 5 5 5 6 6 6 6 7 7 8 8 8 9 9 9 9 9 10 10…
Q: QUESTION 20 Find the range for the given data. Fred, a local mechanic, gathered the following data…
A:
Q: Suppose that the outside temperature versus time curve over a 24-hour period is as shown in the…
A:
Q: Question 3 Approximate the median for following GFDT. (Report answer as the midpo the median.) Data…
A:
Q: Calculate one dispersion and skewness for the following data : measure of central tendency,…
A:
Q: Question 5: the following Pie Chart represents the wage of 40 labors in a factory payed in pound.…
A: 20-29 81 30-39 63 40-49 54 50-59 63 60-69 54 70-79 45 from pie chart 360 degree A= 81…
Q: A study collects samples of water from the tap in Vacaville and from bottled water available from…
A: The observed pH value is 6.32.The mean pH of Tap water is calculated as follows:
Q: Question 2 154 180 211 265 197.5 150 175 200 225 250 275 Cholesterol (in milligrams per deciliter)…
A: Solution: Hey, since there are multiple sub parts posted, we will answer first three sub parts. If…
Q: A simple qualitative data set has been provided. Complete parts (a) through (d) for this data set.…
A: Solution: Given information: The qualitative data set is A B C D E B C D D B
Q: What is the approximate forecast for May using a four-month moving average? Nov. 39 OA 38 Dec. Jan.…
A: The data given, Nov. 39 Dec. 36 Jan. 40 Feb. 42 March 48 April 46
Q: The following are goals scored by a soccer team at each game in their recent season. 0 0 0 0 0 0 0…
A:
Q: Answer the following using the Boxplot attached. 1a) Which region (North or South) has the town…
A: The box plot is used to depict the distribution of dataset. For vertical box plots, the lower end is…
Q: Illustration 11.17. Compute the Pearsonian measure of skewness for the following distribution: Size…
A:
Q: Question 12 Data was collected for 40 randomly selected trees growing in the median strip of a busy…
A: Histogram: Histogram is the graphical way of representing the frequency distribution or relative…
Q: Question 6 What can you derive by applying Distribution (Dist) to part of this formula: ~H = [M• (B…
A:
Q: The frequency distribution representing the number of frequent flier miles accumulated by employees…
A: “Since you have posted a question with multiple sub-parts, we will solve first three sub-parts for…
Q: The following table is frequency distribution for the color of 40 cars in the parking GREEN WHITE…
A:
Q: Question 5 The mean monthly salaries paid to 100 employees of a company were tk. 5000. The mean…
A: Given : The mean monthly salaries paid to 100 employees of a company were to.5000. The mean monthly…
Q: Find the following measures of dispersion for the data below: 15 18 1 15 18 4 3 10 8 9. 8 17 13 2 5…
A:
Q: 10 Identify the independent variable for the following situation: The temperature on June 23rd…
A: “Since you have asked multiple question, we will solve the first question for you. If you want any…
Q: 5. The following data are direct solar intensity measurements (watts/m²) at a location in southern…
A: Please find the solution below. Thank you
Q: Complete the given relative frequency distribution. Outcome 1 2 3 5 Rel. Frequency 0.4 0.1 0.1 0.3…
A: It is an important part of statistics . It is widely used .
Q: The following data were collected in an experiment designed to investigate the impact of different…
A: Solution: State the hypotheses. Null hypothesis: H0: There is no significant difference in mean…
Q: a) The following frequency distribution shows the 50 objects of masses measured nearest to grams.…
A: Draw a histogram for the given data: EXCEL software is used to draw the histogram. Software…
Q: d. By using the frequency distribution table find the Central Tendency Measurements of the student’s…
A:
Q: Which of the following is true about the range? a. measure of central tendency O b. measure of…
A: The study is about the range.
Q: (3) Identify each of the following study as observational or experimental (a) Measuring change in…
A: Given: The objective is to identify each of the following study as observational or experimental
Q: Please, find the Geomatric Mean of the given data. ASAP Monthly rent less than (Rs.) 10 20…
A: Monthly rent less than (Rs.)(X) 10 20 30 40 50 60 70 80 Number of…
Q: Table 12.8 Speed for Selected Stride Lengths a. Adult men Stride length (meters) 2.5 3.0 3.3 3.5 3.8…
A:
Q: Use the information below to answer Question 5 and Question 6. The table below shows the sales (in…
A: Given:
Q: necpts developed in Precalculus to HIUdel aIi uctuul make a prediction. In this case we will model…
A:
Q: 4. Consider the below data set: X 75 80 93 65 87 71 98 68 84 77 y 82 78 86 72 91 80 95 72 89 74 (a)…
A: Hi! Thank you for the question as per the honour code, we’ll answer the first question since the…
Q: Table 2: Observation of Monocot & Dicot Monocot Dicot Location Serrated Lobed Leaf Smooth Serrated…
A: Percentage = Total/ Average ×100v
Q: a. Fill the following table and provide evident that you ask 6 students. Student # 1 3 4 6. Hours 4…
A: Measurements of central tendency are, Mean, Median, Mode. Measurements of dispersion are, Range,…
Q: The lengths of 40 leaves of a plant are measured correct to the nearest millimeter. Less than…
A: A measure of central tendency is a single value that attempts to describe a set of data by…
Q: Like hurricanes and earthquakes, geomagnetic storms are natural hazards with possible severe impact…
A: Given that, the 25 readings of proton flux in the 47-68 KEV range (units are in p/ (cm2…
Q: Based on the data, calculate the following:
A:
Q: 2. A technician collected the following data after measuring the heights of a sample of plants that…
A: Use the given data to calculate the required quantities.
Q: Questions 2 and 3 are individual parts. That is, each group member is to answer the questions for a…
A: Given: Each group member answer to the questions, Member 1: Day 4 Member 2: Day 6 Member 3: Day 8…
Q: Suppose a farm randomly selected 18 watermelons from their harvest and recorded the following…
A: Given information: The data us as given below: 21.3, 22.1, 23.4, 18.1, 15.6, 24.1, 20.3, 20.8, 16.4,…
2- Please I want solution of all subpart questions.Thanks
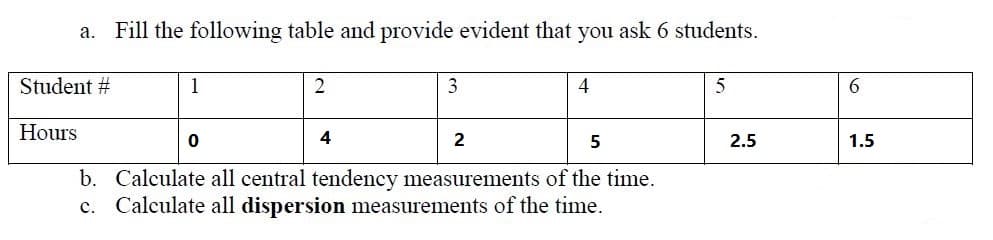
| X | (x-xbar)^2 |
| 0 | 5.444444 |
| 1 | 1.777778 |
| 1.5 | 0.694444 |
| 2.5 | 0.027778 |
| 4 | 2.777778 |
| 5 | 7.111111 |
The mean is given by
The median is given by
Mode
There is no mode in the data.
The Quartile 1 is given by
The Quartile 3 is given by

Step by step
Solved in 3 steps with 5 images


- The MAD for the forecast developed using a weighted 2-year moving average with weights of 0.350.35 and 0.650.65 is what?Which of the above forecasts has lowest magnitude in relative terms? a. 3-period moving average B. Simple Moving Average c. (6,4,3,2) D. Alpha = .3An insurance investigator has observed that people with some astrological signs tend to be safer drivers than people with other signs. Using insurance records, the investigator classified 150 people according to their astrological signs and whether or not they were involved in a car accident during the previous 12 months. Do the following data indicate a significant relationship between sign and accidents? Test with a = .05. Libra Leo Gemini Accident 7 4 19 No Accident 73 46 1
- The cost of five homes in a certain area is given.164000 172000 192000 162000 1242000Which measure of central tendency should be used?From the following data points (15, 24), (18, 37), (22, 25), find the Newton’s second-order divided difference. Round-off to three decimals.John Kittle, an independent insurance agent, uses a five-year moving average to forecast the number of claims made in a single year for one of the large insurance companies he sells for. He has just discovered that a clerk in his employ incorrectly entered the number of claims made four years ago as 1,400 when it should have been 1,200.a. What adjustment should Mr. Kittle make in next year’s forecast to take into account the corrected value of the number of claims four years ago?b. Suppose that Mr. Kittle used simple exponential smoothing with a = .2instead of moving averages to determine his forecast. What adjustment is now required in next year’s forecast? (Note that you do not need to know the value of the forecast for next year in order to solve this problem.)
- Consider the following data where "x" represents days starting on April 1,2020 and "y" is the number of cumulative deaths in Massachusetts attributed to Covid 19. 1.) Use the equation to predict the number of cumulative deaths as of June 14, 2020. Answer with a complete sentence "The predicted number of deaths by June 14 isThe problem is based on the following data given. Observations of the demand for a certain part stocked at a parts supply depot during the calendar year 2013 were ( as shown ). What would an MA(1) forecasting method mean? Compare the accuracy of MA(1) and MA(4) forecasts for July through December 2013.Kaitlyn measures the upload speed in megabits per second of her home broadband internet connection during peak hours and off-peak hours. The results are provided in the accompanying table. Peak Off-Peak 5.83 5.14 6.05 6.80 7.14 6.98 3.54 5.77 5.45 7.27 5.90 6.62 5.81 6.19 4.82 6.08 6.37 6.59 4.65 5.58 5.30 7.41 6.48 6.26 5.96 6.37 5.79 6.31 6.84 6.55 5.06 4.95 5.61 7.03 6.45 6.77 Examine the results of Kaitlyn's test to determine the statements that compare the medians and interquartile ranges of the data sets to each other in terms of this situation. Select the two correct answers. The median upload speed during peak hours is 5.905 megabits per second, which is less than the median upload speed during off-peak hours, 7.005 megabits per second. The upload speeds during peak hours are slower on average compared to off-peak times. The median upload speed during peak hours is 6.37 megabits per second, which is greater than the median upload speed during…
- Obtain the descriptive statistics for each strain. And interpret itThe following pairs of observations tell the result of the laboratory experiment yand the temperature x at which the laboratory experiment was carried out. Observations as following: i xi yi i xi yi1 100 45 7 150 692 110 51 8 160 743 120 54 9 170 784 125 53 10 180 865 130 59 11 190 896 140 63 12 200 94 So the question regarding the table above would be (a) Draw a scatter diagram of the table. (b) Visually draw a line that fits the data (in table) as well as possible.(c) Fit a linear model to the data, i.e. estimate the PNS estimates of the regression line. Compare the regression line you get with the one you drew in (b) (ie compare the slopes/intercepts).(d) Predict the result of the laboratory experiment when the experiment is performed at a temperature of 185. R software or other software for linear regressions should not be used to solve this.Suppose a bee follows the trajectory, at what values of T is the bee flying vertically and or horizontally?