a. Fill the following table and provide evident that you ask 6 students. Student # 1 3 4 6. Hours 4 2 2.5 1.5 b. Calculate all central tendency measurements of the time. c. Calculate all dispersion measurements of the time.
Q: A die was rolled 360 times and the results were: No. of Spots (outcomes) Frequency 1 54 2 70 3 58 4…
A: Given : significance level,α= 0.05
Q: A researcher studies water clarity at the same location in a lake on the same dates during the…
A:
Q: Given the table, identify the following: 1 3 7 11 13 15 17 0.95 1.02 1.26 1.58 1.84 2.01 2.18 2.34…
A:
Q: 6) Use table 2 to answer the following questions: Image distance (mm) 146 174 170 165 175 167 163…
A: “Since you have posted a question with multiple sub-parts, we will solve first three subparts for…
Q: D Question 1 Which of the following variables are considered continuous? number of bread crumbs in…
A: Introduction: It is required to check the solutions to the questions.
Q: 4. Consider the below data set: 65 87 x 75| 80 93 82 78 | 86 68 84 77 72 89 71 98 y 72 91 80 95 74…
A: Given: The data set: - x y 75 82 80 78 93 86 65 72 87 91 71 80 98 95 68 72 84…
Q: a. Fill the following table and provide evident that you ask 6 students. ent # 1 2 3 4 4 2 2.5 1.5…
A: X (x-xbar)^2 0 5.444444 1 1.777778 1.5 0.694444 2.5 0.027778 4 2.777778 5 7.111111
Q: 4. Consider the following grouped data Classes 0-2 2-4 4-6 6-8 8-10 Frequency 8 2 3 5 4 a) Find…
A: (a). Obtain moments about origin and moments about mean. The data represents the frequencies for the…
Q: A researcher studies water clarity at the same location in a lake on the same dates during the…
A: (a). Identify the reason for taking the measurements on the same date: The data represents the water…
Q: QUESTION 20 Find the range for the given data. Fred, a local mechanic, gathered the following data…
A:
Q: Illustration 8.7. Present the data of Table 8.8 by a suitable histo- gram. TABLE 8.8. AVERAGE…
A:
Q: Find the temperature distributions for the rectangular plate if the lower side is adiabatic (h=k=…
A:
Q: O Consider the following data 2 3 4 5 6 y6435 4 2 @ Find the equation of the negression Line O Graph…
A: The linear regression technique uses a dataset to determine a linear function, such that the data…
Q: Suppose that the outside temperature versus time curve over a 24-hour period is as shown in the…
A:
Q: Illustration 10,39. Suppose that a prospective buyer tests bursting pressure of samples of polythene…
A:
Q: A researcher studies water clarity at the same location in a lake on the same dates during the…
A: x y d=x-y d2 53.5 52.1 1.4 1.96 59.3 59.5 -0.2 0.04 63.2 59.7 3.5 12.25 50.3 51.7 -1.4 1.96…
Q: Refer to exhibit 1 below. What is the prediction equation for determining Heat BTU’s? a. Heat…
A: It is asked to find the prediction equation for determining Heat BTU’s. The regression equation that…
Q: Using the diagram provided, determine the measurements for each of the following.
A:
Q: H.W. conruct frequency odi'stri bu tion for the fo il owing data and determine xi , R.freq,…
A:
Q: Massa usetts 45400 55400 115600 185700 ne that the house values are changing linearly, state have…
A: In this question we will use basic of calculus i.e concept of finding values of linear function. We…
Q: The following data represent the muzzle velocity (in feet per second) of rounds fired from a 155-mm…
A: “Since you have posted a question with multiple sub-parts, we will solve first three subparts for…
Q: 4. A school club consists of 20 male students and 11 femal. represent the club in the student…
A: Given data, No of male students=20 No of female students=11 If 4 students are selected P(2 will be…
Q: Question#1 The following data are the measures of the diameters of 36 rivet heads in 1/100 of an…
A: Grouped data,
Q: Illustration 11.17. Compute the Pearsonian measure of skewness for the following distribution: Size…
A:
Q: Ifm PSQ -21°, m&RSQ -34 and m SRP -77, lind the measurements of the following 1. M2PRQ 2. m PQ 3 m…
A:
Q: Illustration 10.9. Calculate standard deviation from the following data: - 6. Frequency 7 Size 9 12…
A:
Q: Illustration 11.16. Calculate quartile coefficient of skewness from the following: Weight No. of…
A:
Q: Question#1 The following data are the measures of the diameters of 36 rivet heads in 1/100 of an…
A: The data is presented in a tabular form through a frequency table. The frequency table is obtained…
Q: Illustration 7.3. Construct an appropriate diagram to present the data in Table 7.7. TABLE 7.7.…
A:
Q: QUESTION 5 Which of the following can be classified as Discrete and Quantitative data. The number of…
A: Hey there.! thank you for posting your question. Hope you’re doing well. Since you have posted…
Q: 5. The following table displays the number of HIV diagnoses per year in a particular country. Year…
A: Consider the year 1997 to be year n=1, similarly the year 1998 will be year n=2, and so on.…
Q: Interpret the standard curve below. 1.4 1.2- 1.0 - 0.8 0.6 0.4 0.2 0.0 200 400 600 800 1000 1200…
A: Explanation of the answer is as follows
Q: Answer the following. Carry your intermediate computations to at least four decimal places, and…
A: The following data is provided: x = Distance from beach y = Selling Price 10.6 207.6 9.8 270…
Q: A researcher studies water clarity at the same location in a lake on the same dates during the…
A: Excel: Data --> Data analysis -->t-Test: Paired Two Sample for Means
Q: The following graph is a standard curve based on the concentrations (in ppm) of the standards…
A: Given the instrument response = 0.8 We will draw lines parallel to the x-axis (as shown in below…
Q: Q. 18. Calculate mode from the following 15 observations : 5, 4, 8, 7, 12, 18, 17, 30, 8, 12, 20,…
A:
Q: Take Homė 1. The four Galilean moons of Jupiter have orbital periods and mean distances from Jupiter…
A:
Q: Table 2: Observation of Monocot & Dicot Monocot Dicot Location Serrated Lobed Leaf Smooth Serrated…
A: Percentage = Total/ Average ×100v
Q: Calculate the surface temperature of the sun based on its emission spectrum 1200 1000 800 600 400…
A: From the diagram we see that the peak wavelength of solar spectrum is obtained approximately at 500.…
Q: Given the table, identify the following: 1 3 5 9 11 13 15 17 0.95 1.02 |1.26 1.58 1.84 2.01 2.18…
A: Calculate Fitting a second degree parabola - Curve fitting using Least square method X Y 1 .95…
Q: Like hurricanes and earthquakes, geomagnetic storms are natural hazards with possible severe impact…
A: Given that, the 25 readings of proton flux in the 47-68 KEV range (units are in p/ (cm2…
Q: Question 4: A sample of 6 children was selected, da kilograms was recorded as shown in the following…
A: to find the correlation and the scatter plot
Q: Illustration 21.9. Compare the association between literacy and unemployment in urban and rural…
A:
Q: 1- Plot sawtooth waveform as shown below mww. 5 10 15 20 25 30
A: >>T=30; >>fs=1000; >>t=0:1/fs: T; >>x=2+2*sawtooth(2*pi*t/5);…
Q: Illustration 13,1. Construct index numbers of prices from the following data using (a) Laspeyre's…
A:
Q: Questions 2 and 3 are individual parts. That is, each group member is to answer the questions for a…
A: Given: Each group member answer to the questions, Member 1: Day 4 Member 2: Day 6 Member 3: Day 8…
Q: Question1) The annual precipitation data (mm) recorded at Kumköy. Istanbul in period 1952-1990 are…
A: Hello. Since your question has multiple sub-parts, we will solve first three sub-parts for you. If…
Q: Illustration 33. The heights of mothers and daughters are given in the following table. From the two…
A: Given: x (mother) y (daughter) 62 64 63 65 64 61 64 69 65 67 66 68 68 71 70 65
2- I want solution of all sub-part questions. Thanks
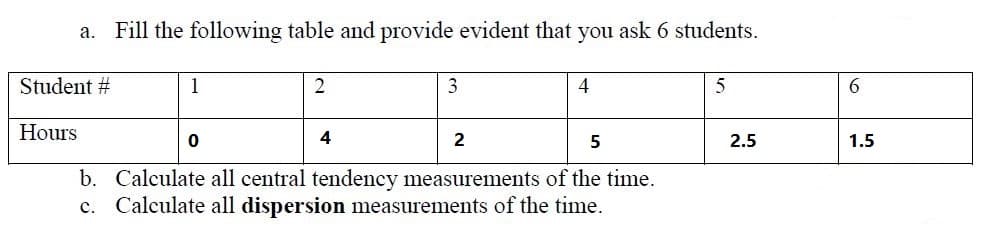
Step by step
Solved in 2 steps with 1 images
- The MAD for the forecast developed using a weighted 2-year moving average with weights of 0.350.35 and 0.650.65 is what?Which of the above forecasts has lowest magnitude in relative terms? a. 3-period moving average B. Simple Moving Average c. (6,4,3,2) D. Alpha = .3An insurance investigator has observed that people with some astrological signs tend to be safer drivers than people with other signs. Using insurance records, the investigator classified 150 people according to their astrological signs and whether or not they were involved in a car accident during the previous 12 months. Do the following data indicate a significant relationship between sign and accidents? Test with a = .05. Libra Leo Gemini Accident 7 4 19 No Accident 73 46 1
- The cost of five homes in a certain area is given.164000 172000 192000 162000 1242000Which measure of central tendency should be used?From the following data points (15, 24), (18, 37), (22, 25), find the Newton’s second-order divided difference. Round-off to three decimals.John Kittle, an independent insurance agent, uses a five-year moving average to forecast the number of claims made in a single year for one of the large insurance companies he sells for. He has just discovered that a clerk in his employ incorrectly entered the number of claims made four years ago as 1,400 when it should have been 1,200.a. What adjustment should Mr. Kittle make in next year’s forecast to take into account the corrected value of the number of claims four years ago?b. Suppose that Mr. Kittle used simple exponential smoothing with a = .2instead of moving averages to determine his forecast. What adjustment is now required in next year’s forecast? (Note that you do not need to know the value of the forecast for next year in order to solve this problem.)
- Consider the following data where "x" represents days starting on April 1,2020 and "y" is the number of cumulative deaths in Massachusetts attributed to Covid 19. 1.) Use the equation to predict the number of cumulative deaths as of June 14, 2020. Answer with a complete sentence "The predicted number of deaths by June 14 isThe problem is based on the following data given. Observations of the demand for a certain part stocked at a parts supply depot during the calendar year 2013 were ( as shown ). What would an MA(1) forecasting method mean? Compare the accuracy of MA(1) and MA(4) forecasts for July through December 2013.Kaitlyn measures the upload speed in megabits per second of her home broadband internet connection during peak hours and off-peak hours. The results are provided in the accompanying table. Peak Off-Peak 5.83 5.14 6.05 6.80 7.14 6.98 3.54 5.77 5.45 7.27 5.90 6.62 5.81 6.19 4.82 6.08 6.37 6.59 4.65 5.58 5.30 7.41 6.48 6.26 5.96 6.37 5.79 6.31 6.84 6.55 5.06 4.95 5.61 7.03 6.45 6.77 Examine the results of Kaitlyn's test to determine the statements that compare the medians and interquartile ranges of the data sets to each other in terms of this situation. Select the two correct answers. The median upload speed during peak hours is 5.905 megabits per second, which is less than the median upload speed during off-peak hours, 7.005 megabits per second. The upload speeds during peak hours are slower on average compared to off-peak times. The median upload speed during peak hours is 6.37 megabits per second, which is greater than the median upload speed during…
- Obtain the descriptive statistics for each strain. And interpret itThe following pairs of observations tell the result of the laboratory experiment yand the temperature x at which the laboratory experiment was carried out. Observations as following: i xi yi i xi yi1 100 45 7 150 692 110 51 8 160 743 120 54 9 170 784 125 53 10 180 865 130 59 11 190 896 140 63 12 200 94 So the question regarding the table above would be (a) Draw a scatter diagram of the table. (b) Visually draw a line that fits the data (in table) as well as possible.(c) Fit a linear model to the data, i.e. estimate the PNS estimates of the regression line. Compare the regression line you get with the one you drew in (b) (ie compare the slopes/intercepts).(d) Predict the result of the laboratory experiment when the experiment is performed at a temperature of 185. R software or other software for linear regressions should not be used to solve this.Suppose a bee follows the trajectory, at what values of T is the bee flying vertically and or horizontally?