
Practical Management Science
6th Edition
ISBN: 9781337406659
Author: WINSTON, Wayne L.
Publisher: Cengage,
expand_more
expand_more
format_list_bulleted
Related questions
Question
7
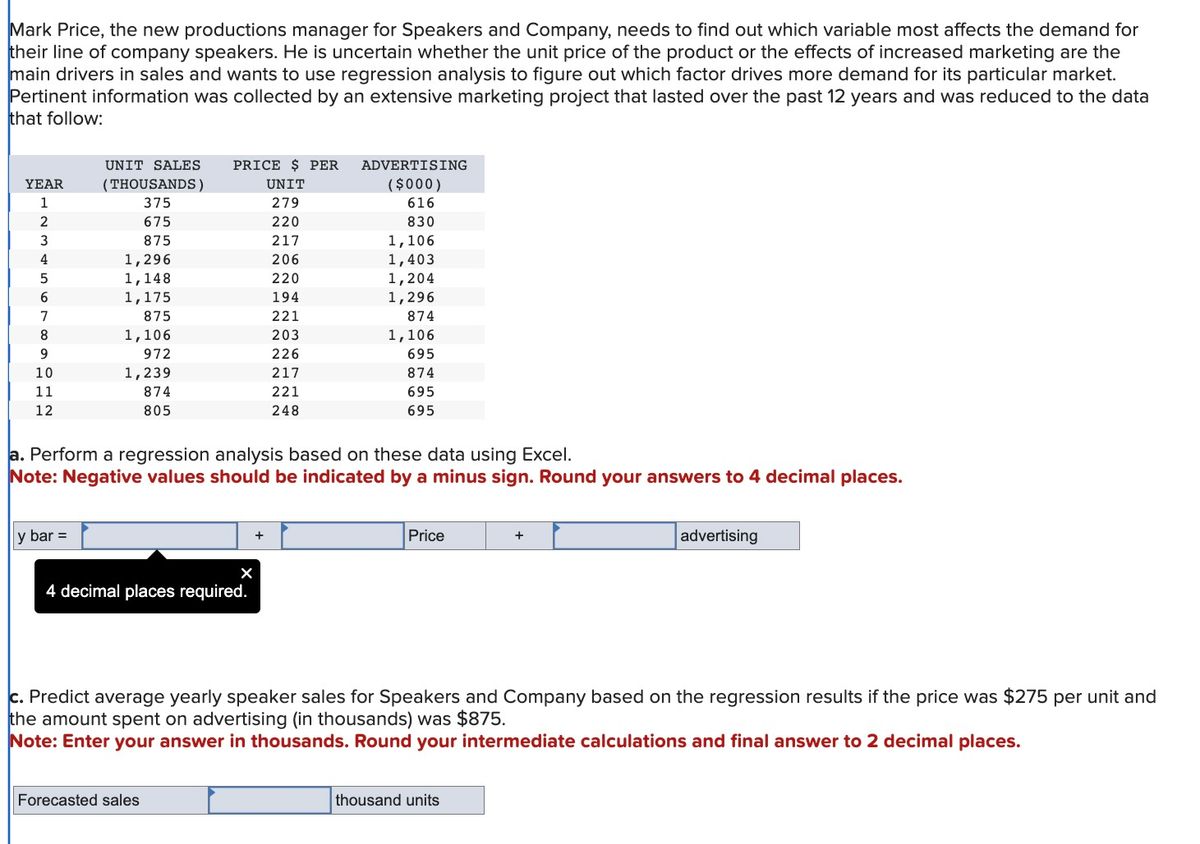

Transcribed Image Text:Mark Price, the new productions manager for Speakers and Company, needs to find out which variable most affects the demand for
their line of company speakers. He is uncertain whether the unit price of the product or the effects of increased marketing are the
main drivers in sales and wants to use regression analysis to figure out which factor drives more demand for its particular market.
Pertinent information was collected by an extensive marketing project that lasted over the past 12 years and was reduced to the data
that follow:
YEAR
1
23456
7
8
9
10
11
12
UNIT SALES PRICE $ PER
UNIT
279
220
217
206
220
194
221
203
226
217
221
248
y bar =
(THOUSANDS)
375
675
875
1,296
1,148
1,175
875
1,106
972
1,239
874
805
a. Perform a regression analysis based on these data using Excel.
Note: Negative values should be indicated by a minus sign. Round your answers to 4 decimal places.
4 decimal places required.
Forecasted sales
+
X
ADVERTISING
($000)
616
830
1,106
1,403
1,204
1,296
874
1,106
695
874
695
695
Price
c. Predict average yearly speaker sales for Speakers and Company based on the regression results if the price was $275 per unit and
the amount spent on advertising (in thousands) was $875.
Note: Enter your answer in thousands. Round your intermediate calculations and final answer to 2 decimal places.
advertising
thousand units
Expert Solution
This question has been solved!
Explore an expertly crafted, step-by-step solution for a thorough understanding of key concepts.

This is a popular solution

Trending nowThis is a popular solution!

Step by stepSolved in 4 steps with 3 images

Knowledge Booster

Similar questions
- 2. Chapter 5--Assume you are hired as a consultant for Cinnabon. You are asked to consider a SWOT model to determine their strengths and weaknesses. Using the Course Outcome 4.1 decide and objectively recommend next steps for Cinnabonarrow_forwardQ. 1. Calculate the amount of water required (kg/hr) in a heat exchanger that cools down 100 kg/h of corn slurry from 90 °C to 30 °C. The slurry contains 30% solids from a corn variety having 70% starch, 10% protein, 4% oil, 10% fiber and 6% ash on a dry basis. The inlet water temperature is 10 °C and the heated water temperature is not to exceed 40 °C. The datum temperature for this problem should be assumed to be 10 °C? Q. 2. Using the corn dry grind process, how much theoretical ethanol yield (in gallons) can be obtained from a 100 bushels corn sample having 12% moisture content and containing 70% starch on a dry basis? ""arrow_forwardQ.12. Profits do not have to be shared. This statement refers to:A. PartnershipB. Sole proprietorshipC. CompanyD. Corporates. Select onearrow_forward
- Ch8 1. The chapter discusses the notion of transfer of training. Why is transfer of training so important? Pretend you are a training coordinator in an auto wheel assembly plant. What steps would you take to enhance transfer of training among your training participants?”arrow_forward<. FROM T. I 13 Paragraph Styles A company produces its automobile model in three plants located in Flint, Michigan; Fresno, California; and Monterrey, Mexico. The cars are distributed to dealers through the regional distribution centers located in Phoenix, Arizona; Davenport, Iowa; and Columbia, South Carolina. Anticipated production at the plants over the next month is 3,300 cars at Flint, 2,600 cars at Fresno, and. 3,100 cars at Monterrey. Based on firm orders and other requests from dealers, the company has decided that it needs to have the following numbers of cars at the regional distribution centers at the end of the month: Phoenix - 2,600 cars; Davenport- 2,800 cars; and Columbia – 3,000 cars. | In order to deal more effectively with unforeseen events (such as the road closing), the company has established two transshipment points between the plants and the regional distribution centers. The two transshipment points are located at Santa Fe, New Mexico, and Jefferson City,…arrow_forward470 q 16 a speculative stock possessees a _________ probability of _________ return and is currently _______- a. high, negative, underpriced b. high, negative, overpriced c. high, positive, overpriced d. low, negative, overpriced e. low, positive, underpricedarrow_forward
- Ex 4.12 Formulate the linear programming model of the following problems. Titan Credit Card Marketing works for HSBC to verify and approve credit card application. TCCM receives P380 for every completed customer application. The company maintained three call agents targeting at P20,000 worth of approvals daily, altogether. In a regular working day, James can process as much as P3000 worth of applications. Mark can process twice as much as Tim. How many credit cards should each call agent process to achieve the target for the day. Formulate the LP modelarrow_forwardA.3 Yellowburn University, a not-for-profit higher education organization, has the following mission statement: ‘We aim to deliver excellent tuition in state-of-the-art facilities to help develop socially responsible students and to contribute to global academic research.’ Which TWO of the following would be appropriate objectives to fit in with this mission? To deliver the best possible lessons. Each member of staff is to write two research papers for publication over the next two years. To increase car parking space at the university by 10% in the next 12 months to improve access. To get 15% of all students to receive first class honors degrees each year. To ensure 100% attendance from all students for every lecture.arrow_forwardF1. Subject :- finance a business worth $125,000 is expected to grow at 3% per year compounded annually for the next 2 years. Find the expected future value.arrow_forward
arrow_back_ios
arrow_forward_ios
Recommended textbooks for you
- Practical Management ScienceOperations ManagementISBN:9781337406659Author:WINSTON, Wayne L.Publisher:Cengage,
 Operations ManagementOperations ManagementISBN:9781259667473Author:William J StevensonPublisher:McGraw-Hill Education
 Operations and Supply Chain Management (Mcgraw-hi...Operations ManagementISBN:9781259666100Author:F. Robert Jacobs, Richard B ChasePublisher:McGraw-Hill Education
 Purchasing and Supply Chain ManagementOperations ManagementISBN:9781285869681Author:Robert M. Monczka, Robert B. Handfield, Larry C. Giunipero, James L. PattersonPublisher:Cengage Learning
 Production and Operations Analysis, Seventh Editi...Operations ManagementISBN:9781478623069Author:Steven Nahmias, Tava Lennon OlsenPublisher:Waveland Press, Inc.
Practical Management Science
Operations Management
ISBN:9781337406659
Author:WINSTON, Wayne L.
Publisher:Cengage,
Operations Management
Operations Management
ISBN:9781259667473
Author:William J Stevenson
Publisher:McGraw-Hill Education
Operations and Supply Chain Management (Mcgraw-hi...
Operations Management
ISBN:9781259666100
Author:F. Robert Jacobs, Richard B Chase
Publisher:McGraw-Hill Education
Purchasing and Supply Chain Management
Operations Management
ISBN:9781285869681
Author:Robert M. Monczka, Robert B. Handfield, Larry C. Giunipero, James L. Patterson
Publisher:Cengage Learning
Production and Operations Analysis, Seventh Editi...
Operations Management
ISBN:9781478623069
Author:Steven Nahmias, Tava Lennon Olsen
Publisher:Waveland Press, Inc.