a. Plot the demand and supply curves, Dy and Sj in the graphing area below. Also mark the equilibrium, E1, in the graph. Choose the appropriate tool and plot only the two endpoints for every line or curve drawn in the graph below. Remember to also plot the equilibrium using the tool E. Market for Wool in Odessa 800 Tools 700 600 500 400 S, 300 200 E, 100 20 40 60 80 100 120 140 160 180 200 Quantity of wool (tonnes per year) | b. The equilibrium price is $ 600 O and the equilibrium quantity is 60 tonnes per year. c. If the price of wool was $400, there would be a shortage O of 60]© tonnes per year. d. Suppose that the demand were to increase by 30. Show the new quantity demanded 2 in the table above. e. Draw the new demand curve. D2. in the graph and mark the new equilibrium as E2. Plot the two endpoints of the new demand curve and the equilibrium, E2 Price
a. Plot the demand and supply curves, Dy and Sj in the graphing area below. Also mark the equilibrium, E1, in the graph. Choose the appropriate tool and plot only the two endpoints for every line or curve drawn in the graph below. Remember to also plot the equilibrium using the tool E. Market for Wool in Odessa 800 Tools 700 600 500 400 S, 300 200 E, 100 20 40 60 80 100 120 140 160 180 200 Quantity of wool (tonnes per year) | b. The equilibrium price is $ 600 O and the equilibrium quantity is 60 tonnes per year. c. If the price of wool was $400, there would be a shortage O of 60]© tonnes per year. d. Suppose that the demand were to increase by 30. Show the new quantity demanded 2 in the table above. e. Draw the new demand curve. D2. in the graph and mark the new equilibrium as E2. Plot the two endpoints of the new demand curve and the equilibrium, E2 Price

Chapter1: Making Economics Decisions
Section: Chapter Questions
Problem 1QTC

Related questions
Question
Please help with Question E
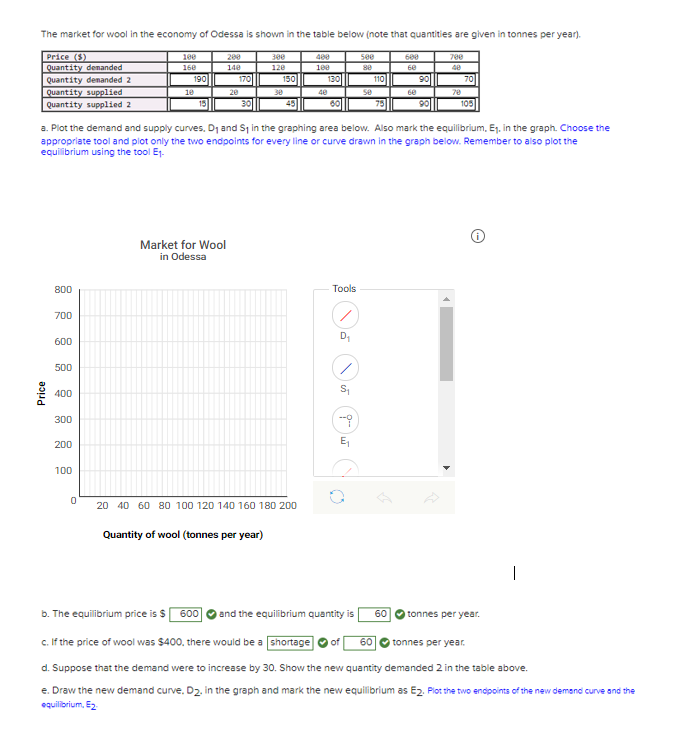
Transcribed Image Text:The market for wool in the economy of Odessa is shown in the table below (note that quantities are given in tonnes per year).
Price ($)
Quantity denanded
Quantity denanded 2
Quantity supplied
Quantity supplied 2
100
200
300
400
500
600
700
16e
140
120
100
se
6e
190
170
150
130
110
90
70
10
20
30
40
se
6e
70
15
30
45
60
75
90
105
a. Plot the demand and supply curves. Di and Si in the graphing area below. Also mark the equilibrium. E1. in the graph. Choose the
appropriate tool and plot only the two endpoints for every line or curve drawn in the graph below. Remember to also plot the
equilibrium using the tool E.
Market for Wool
in Odessa
800
Tools
700
D1
600
500
S
400
300
200
100
20 40 60 80 100 120 140 160 180 200
Quantity of wool (tonnes per year)
|
b. The equilibrium price is $
and the equilibrium quantity is
600
60
tonnes per year.
c. If the price of wool was $400, there would be a shortage
of
60 O tonnes per year.
d. Suppose that the demand were to increase by 30. Show the new quantity demanded 2 in the table above.
e. Draw the new demand curve. D2. in the graph and mark the new equilibrium as E2. Plot the two endpoints of the new demand curve and the
equilibrium, E2.
Price
Expert Solution
This question has been solved!
Explore an expertly crafted, step-by-step solution for a thorough understanding of key concepts.

This is a popular solution!

Trending now
This is a popular solution!

Step by step
Solved in 2 steps with 1 images

Knowledge Booster


Learn more about
Need a deep-dive on the concept behind this application? Look no further. Learn more about this topic, economics and related others by exploring similar questions and additional content below.Recommended textbooks for you

Principles of Economics (12th Edition)
Economics
ISBN:
9780134078779
Author:
Karl E. Case, Ray C. Fair, Sharon E. Oster
Publisher:
PEARSON

Engineering Economy (17th Edition)
Economics
ISBN:
9780134870069
Author:
William G. Sullivan, Elin M. Wicks, C. Patrick Koelling
Publisher:
PEARSON
Principles of Economics (12th Edition)
Economics
ISBN:
9780134078779
Author:
Karl E. Case, Ray C. Fair, Sharon E. Oster
Publisher:
PEARSON
Engineering Economy (17th Edition)
Economics
ISBN:
9780134870069
Author:
William G. Sullivan, Elin M. Wicks, C. Patrick Koelling
Publisher:
PEARSON

Principles of Economics (MindTap Course List)
Economics
ISBN:
9781305585126
Author:
N. Gregory Mankiw
Publisher:
Cengage Learning

Managerial Economics: A Problem Solving Approach
Economics
ISBN:
9781337106665
Author:
Luke M. Froeb, Brian T. McCann, Michael R. Ward, Mike Shor
Publisher:
Cengage Learning

Managerial Economics & Business Strategy (Mcgraw-…
Economics
ISBN:
9781259290619
Author:
Michael Baye, Jeff Prince
Publisher:
McGraw-Hill Education