a. The Y axis is the strength of association between prostate cancer and the variant. b. The spike at the end of Chr 6 indicate the presence of a low risk allele for breast cancer. c. There are 6 SNPs that are associated with increased risk for prostate cancer. Od. The low heritability of prostate cancer makes GWAS an excellent tool for understanding prostate cancer risk. e. The X axis represents any loci in the genome with variation.
a. The Y axis is the strength of association between prostate cancer and the variant. b. The spike at the end of Chr 6 indicate the presence of a low risk allele for breast cancer. c. There are 6 SNPs that are associated with increased risk for prostate cancer. Od. The low heritability of prostate cancer makes GWAS an excellent tool for understanding prostate cancer risk. e. The X axis represents any loci in the genome with variation.

Human Heredity: Principles and Issues (MindTap Course List)
11th Edition
ISBN:9781305251052
Author:Michael Cummings
Publisher:Michael Cummings
Chapter11: Genome Alterations: Mutation And Epigenetics
Section: Chapter Questions
Problem 16QP: Familial retinoblastoma, a rare autosomal dominant defect, arose in a large family that had no prior...

Related questions

Topic Video
Question
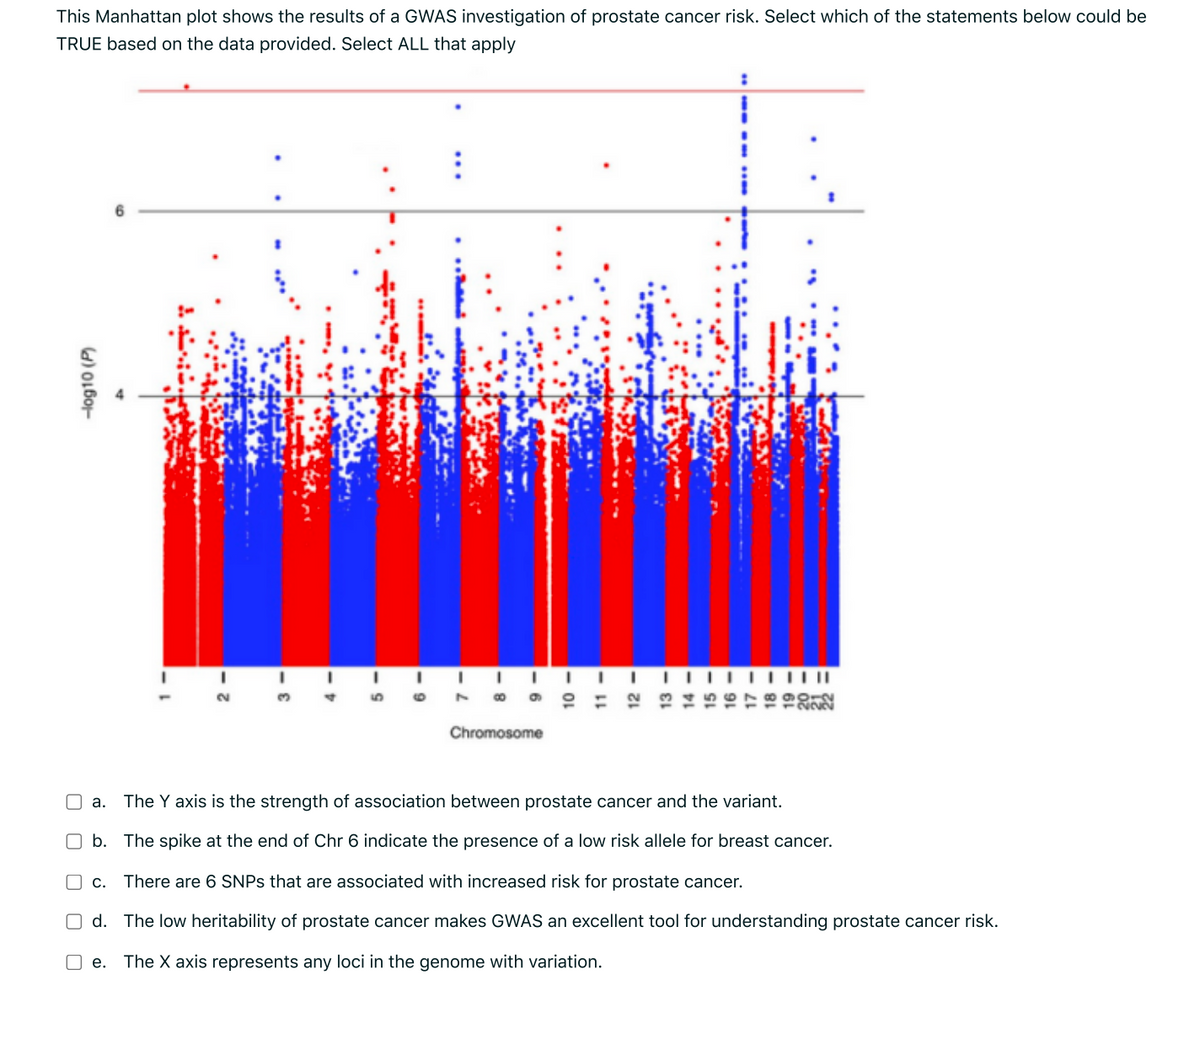
Transcribed Image Text:This Manhattan plot shows the results of a GWAS investigation of prostate cancer risk. Select which of the statements below could be
TRUE based on the data provided. Select ALL that apply
4,
Chromosome
а.
The Y axis is the strength of association between prostate cancer and the variant.
b. The spike at the end of Chr 6 indicate the presence of a low risk allele for breast cancer.
O c.
There are 6 SNPS that are associated with increased risk for prostate cancer.
O d. The low heritability of prostate cancer makes GWAS an excellent tool for understanding prostate cancer risk.
O e.
The X axis represents any loci in the genome with variation.
-Hog10 (P)
Expert Solution
This question has been solved!
Explore an expertly crafted, step-by-step solution for a thorough understanding of key concepts.

Step by step
Solved in 3 steps

Knowledge Booster


Learn more about
Need a deep-dive on the concept behind this application? Look no further. Learn more about this topic, biology and related others by exploring similar questions and additional content below.Recommended textbooks for you
Human Heredity: Principles and Issues (MindTap Co…
Biology
ISBN:
9781305251052
Author:
Michael Cummings
Publisher:
Cengage Learning
Human Heredity: Principles and Issues (MindTap Co…
Biology
ISBN:
9781305251052
Author:
Michael Cummings
Publisher:
Cengage Learning