Age/Preference Alcohol Soft drink Coffee/tea Total 21-39 96 55 36 187 40-65 93 75 52 220 Over 65 74 59 55 188 Total 263 189 143 595 random sample of adults was asked what their beverage of choice is when they go out to dinner. At a 10% evel of Significance, use the data in the table to determine whether age and beverage choice are ndependent. . The hypotheses are : O Ho:Age and drink preference are not independent Ha:Age and drink preference are independent O Ho:Age and drink preference are independent Ha:Age and drink preference are not independent . This is a O rightO leftO two tailed test; d.f. = a. The STS (to 2 decimals) is x² = b. The P-value (to 3 decimals) = a. The decision at a = 10% is O Do not reject Ho O Reiest He
Age/Preference Alcohol Soft drink Coffee/tea Total 21-39 96 55 36 187 40-65 93 75 52 220 Over 65 74 59 55 188 Total 263 189 143 595 random sample of adults was asked what their beverage of choice is when they go out to dinner. At a 10% evel of Significance, use the data in the table to determine whether age and beverage choice are ndependent. . The hypotheses are : O Ho:Age and drink preference are not independent Ha:Age and drink preference are independent O Ho:Age and drink preference are independent Ha:Age and drink preference are not independent . This is a O rightO leftO two tailed test; d.f. = a. The STS (to 2 decimals) is x² = b. The P-value (to 3 decimals) = a. The decision at a = 10% is O Do not reject Ho O Reiest He

Functions and Change: A Modeling Approach to College Algebra (MindTap Course List)
6th Edition
ISBN:9781337111348
Author:Bruce Crauder, Benny Evans, Alan Noell
Publisher:Bruce Crauder, Benny Evans, Alan Noell
Chapter5: A Survey Of Other Common Functions
Section5.6: Higher-degree Polynomials And Rational Functions
Problem 5E: Population Genetics In the study of population genetics, an important measure of inbreeding is the...

Related questions
Question
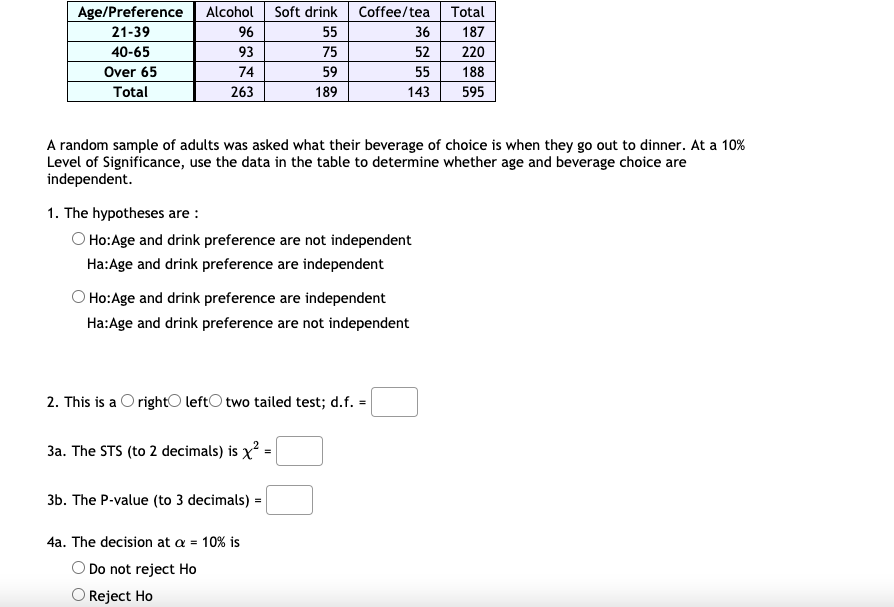
Transcribed Image Text:Age/Preference
Alcohol
Soft drink
Coffee/tea
Total
21-39
96
55
36
187
40-65
93
75
52
220
Over 65
74
59
55
188
Total
263
189
143
595
A random sample of adults was asked what their beverage of choice is when they go out to dinner. At a 10%
Level of Significance, use the data in the table to determine whether age and beverage choice are
independent.
1. The hypotheses are :
O Ho:Age and drink preference are not independent
Ha:Age and drink preference are independent
O Ho:Age and drink preference are independent
Ha:Age and drink preference are not independent
2. This is a O rightO leftO two tailed test; d.f. =
3a. The STS (to 2 decimals) is x? =
3b. The P-value (to 3 decimals) =
4a. The decision at a = 10% is
O Do not reject Ho
O Reject Ho
Expert Solution
This question has been solved!
Explore an expertly crafted, step-by-step solution for a thorough understanding of key concepts.

Step by step
Solved in 2 steps with 2 images

Knowledge Booster


Learn more about
Need a deep-dive on the concept behind this application? Look no further. Learn more about this topic, statistics and related others by exploring similar questions and additional content below.Recommended textbooks for you
Functions and Change: A Modeling Approach to Coll…
Algebra
ISBN:
9781337111348
Author:
Bruce Crauder, Benny Evans, Alan Noell
Publisher:
Cengage Learning

College Algebra (MindTap Course List)
Algebra
ISBN:
9781305652231
Author:
R. David Gustafson, Jeff Hughes
Publisher:
Cengage Learning
Functions and Change: A Modeling Approach to Coll…
Algebra
ISBN:
9781337111348
Author:
Bruce Crauder, Benny Evans, Alan Noell
Publisher:
Cengage Learning
College Algebra (MindTap Course List)
Algebra
ISBN:
9781305652231
Author:
R. David Gustafson, Jeff Hughes
Publisher:
Cengage Learning