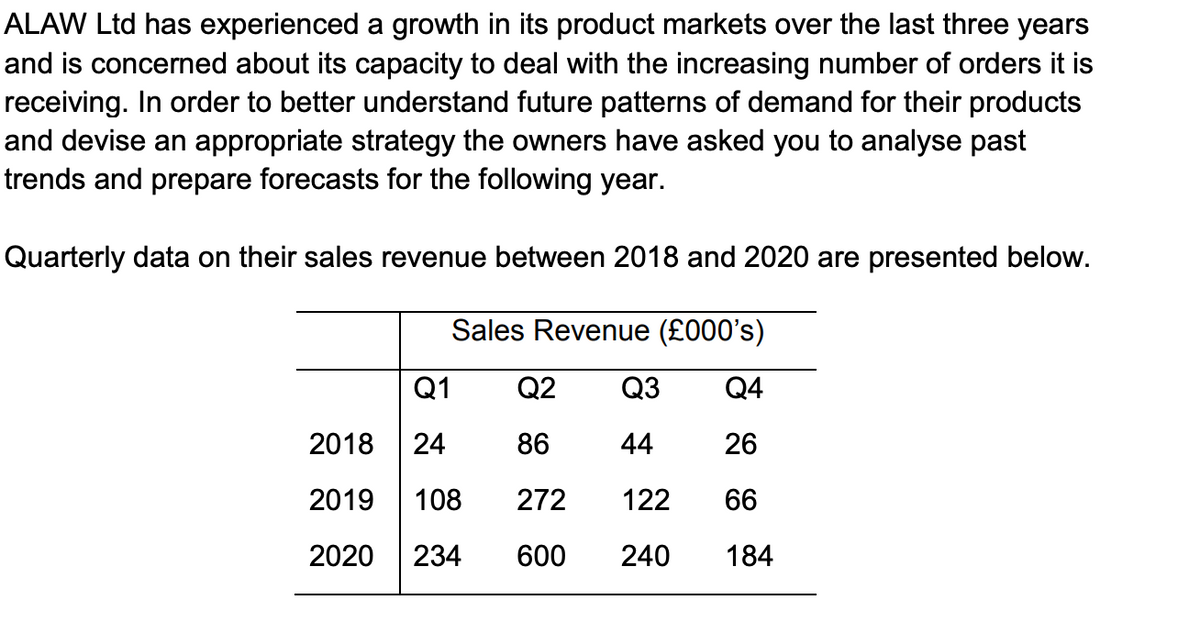
ALAW Ltd has experienced a growth in its product markets over the last three years and is concerned about its capacity to deal with the increasing number of orders it is receiving. In order to better understand future patterns of demand for their products and devise an appropriate strategy the owners have asked you to analyse past trends and prepare forecasts for the following year. Quarterly data on their sales revenue between 2018 and 2020 are presented below. Sales Revenue (£000's) Q1 Q2 Q3 Q4 2018 24 86 44 26 2019 108 272 122 66 2020 234 600 240 184
ALAW Ltd has experienced a growth in its product markets over the last three years and is concerned about its capacity to deal with the increasing number of orders it is receiving. In order to better understand future patterns of demand for their products and devise an appropriate strategy the owners have asked you to analyse past trends and prepare forecasts for the following year. Quarterly data on their sales revenue between 2018 and 2020 are presented below. Sales Revenue (£000's) Q1 Q2 Q3 Q4 2018 24 86 44 26 2019 108 272 122 66 2020 234 600 240 184

Algebra & Trigonometry with Analytic Geometry
13th Edition
ISBN:9781133382119
Author:Swokowski
Publisher:Swokowski
Chapter5: Inverse, Exponential, And Logarithmic Functions
Section: Chapter Questions
Problem 6DE

Related questions
Question
Plot the sales revenue figures and appropriate trend line on a graph and identify from this the choice of model for working out the seasonal component.
Using the appropriate seasonal model, complete the calculations that are required to produce the required forecasts for quarters 1, 2, 3 and 4 of 2021.
On the basis of your analysis explain the recommendation that you would make to ALAW Ltd regarding its future plans.
Transcribed Image Text:ALAW Ltd has experienced a growth in its product markets over the last three years
and is concerned about its capacity to deal with the increasing number of orders it is
receiving. In order to better understand future patterns of demand for their products
and devise an appropriate strategy the owners have asked you to analyse past
trends and prepare forecasts for the following year.
Quarterly data on their sales revenue between 2018 and 2020 are presented below.
Sales Revenue (£000's)
Q1
Q2
Q3
Q4
2018
24
86
44
26
2019
108
272
122
66
2020
234
600
240
184
Expert Solution
This question has been solved!
Explore an expertly crafted, step-by-step solution for a thorough understanding of key concepts.

Step by step
Solved in 2 steps with 1 images

Knowledge Booster


Learn more about
Need a deep-dive on the concept behind this application? Look no further. Learn more about this topic, statistics and related others by exploring similar questions and additional content below.Recommended textbooks for you
Algebra & Trigonometry with Analytic Geometry
Algebra
ISBN:
9781133382119
Author:
Swokowski
Publisher:
Cengage

Algebra & Trigonometry with Analytic Geometry
Algebra
ISBN:
9781133382119
Author:
Swokowski
Publisher:
Cengage