A pharmacist has been monitoring sales of a certain over-the-counter pain reliever. Daily sales during the last 15 days were Day: Number 1 3 8 sold: 33 36 37 44 41 45 46 44 48 Day: Number 10 11 12 13 14 15 sold: 49 44 45 45 53 52 a. Assume the data refer to demand rather than sales. Using trend-adjusted exponential smoothing with an initial forecast of 44 for Day 8, an initial trend estimate of 2, and a = B = 3, develop demand forecasts for Days 9 through 16. Then compute the resultant MSE using the error values from Days 8 through 15. (Round your intermediate period-by-period forecast and error values to 3 decimal places. Round your final MSE answer to 3 decimal places.) MSE
A pharmacist has been monitoring sales of a certain over-the-counter pain reliever. Daily sales during the last 15 days were Day: Number 1 3 8 sold: 33 36 37 44 41 45 46 44 48 Day: Number 10 11 12 13 14 15 sold: 49 44 45 45 53 52 a. Assume the data refer to demand rather than sales. Using trend-adjusted exponential smoothing with an initial forecast of 44 for Day 8, an initial trend estimate of 2, and a = B = 3, develop demand forecasts for Days 9 through 16. Then compute the resultant MSE using the error values from Days 8 through 15. (Round your intermediate period-by-period forecast and error values to 3 decimal places. Round your final MSE answer to 3 decimal places.) MSE

Chapter6: Exponential And Logarithmic Functions
Section6.8: Fitting Exponential Models To Data
Problem 5SE: What does the y -intercept on the graph of a logistic equation correspond to for a population...

Related questions
Question
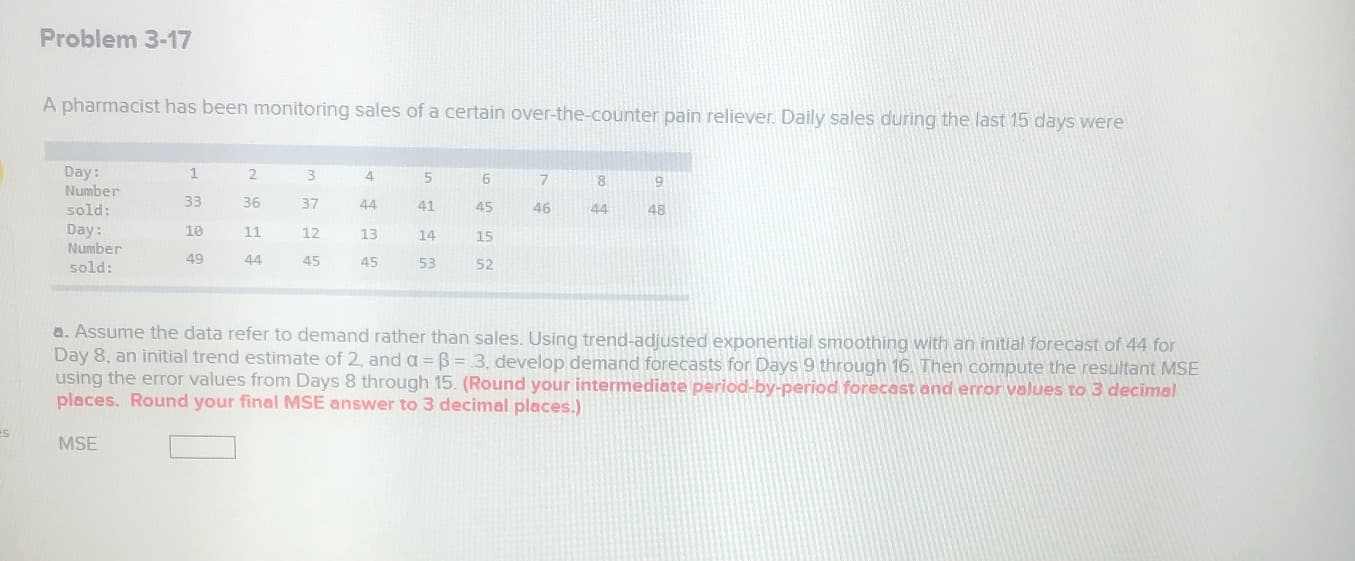
Transcribed Image Text:A pharmacist has been monitoring sales of a certain over-the-counter pain reliever. Daily sales during the last 15 days were
Day:
Number
1
3
8
sold:
33
36
37
44
41
45
46
44
48
Day:
Number
10
11
12
13
14
15
sold:
49
44
45
45
53
52
a. Assume the data refer to demand rather than sales. Using trend-adjusted exponential smoothing with an initial forecast of 44 for
Day 8, an initial trend estimate of 2, and a = B = 3, develop demand forecasts for Days 9 through 16. Then compute the resultant MSE
using the error values from Days 8 through 15. (Round your intermediate period-by-period forecast and error values to 3 decimal
places. Round your final MSE answer to 3 decimal places.)
MSE
Expert Solution
This question has been solved!
Explore an expertly crafted, step-by-step solution for a thorough understanding of key concepts.

This is a popular solution!

Trending now
This is a popular solution!

Step by step
Solved in 4 steps with 5 images

Knowledge Booster


Learn more about
Need a deep-dive on the concept behind this application? Look no further. Learn more about this topic, statistics and related others by exploring similar questions and additional content below.Recommended textbooks for you