The number of heart surgeries performed at Heartville General Hospital has increased steadily over the past years. The hospital's administration is seeking the best method to forecast the demand for such surgeries in 1998. The data for the past five years are shown. Six years ago, the forecast for 1993 was 41 surgeries, and the estimated trend was an increase of 2 per year. Year Demand 1993 45 1994 50 1995 52 1996 56 1997 58 The hospital's administration is considering the following forecasting methods. i. Trend-adjusted exponential smoothing with a= 0.6 and ß = 0.1 ii. Regression Model, y = 42.6 + 3.2x where y is the number of surgeries and x is the index for the year. 1. Find the MAD for trend-adjusted exponential smoothing for a and ß. Present the data in a table.
The number of heart surgeries performed at Heartville General Hospital has increased steadily over the past years. The hospital's administration is seeking the best method to forecast the demand for such surgeries in 1998. The data for the past five years are shown. Six years ago, the forecast for 1993 was 41 surgeries, and the estimated trend was an increase of 2 per year. Year Demand 1993 45 1994 50 1995 52 1996 56 1997 58 The hospital's administration is considering the following forecasting methods. i. Trend-adjusted exponential smoothing with a= 0.6 and ß = 0.1 ii. Regression Model, y = 42.6 + 3.2x where y is the number of surgeries and x is the index for the year. 1. Find the MAD for trend-adjusted exponential smoothing for a and ß. Present the data in a table.

Linear Algebra: A Modern Introduction
4th Edition
ISBN:9781285463247
Author:David Poole
Publisher:David Poole
Chapter4: Eigenvalues And Eigenvectors
Section4.6: Applications And The Perron-frobenius Theorem
Problem 25EQ

Related questions
Question
Lesson about Forecasting: Linear Regression and Measures of Variations, see photo for details, numbers 4, 5, and 6 only.
Hi i'm the one that sent this question earlier and i'm sending this again like you said, hehe. Thank you so much for your help! ♡︎
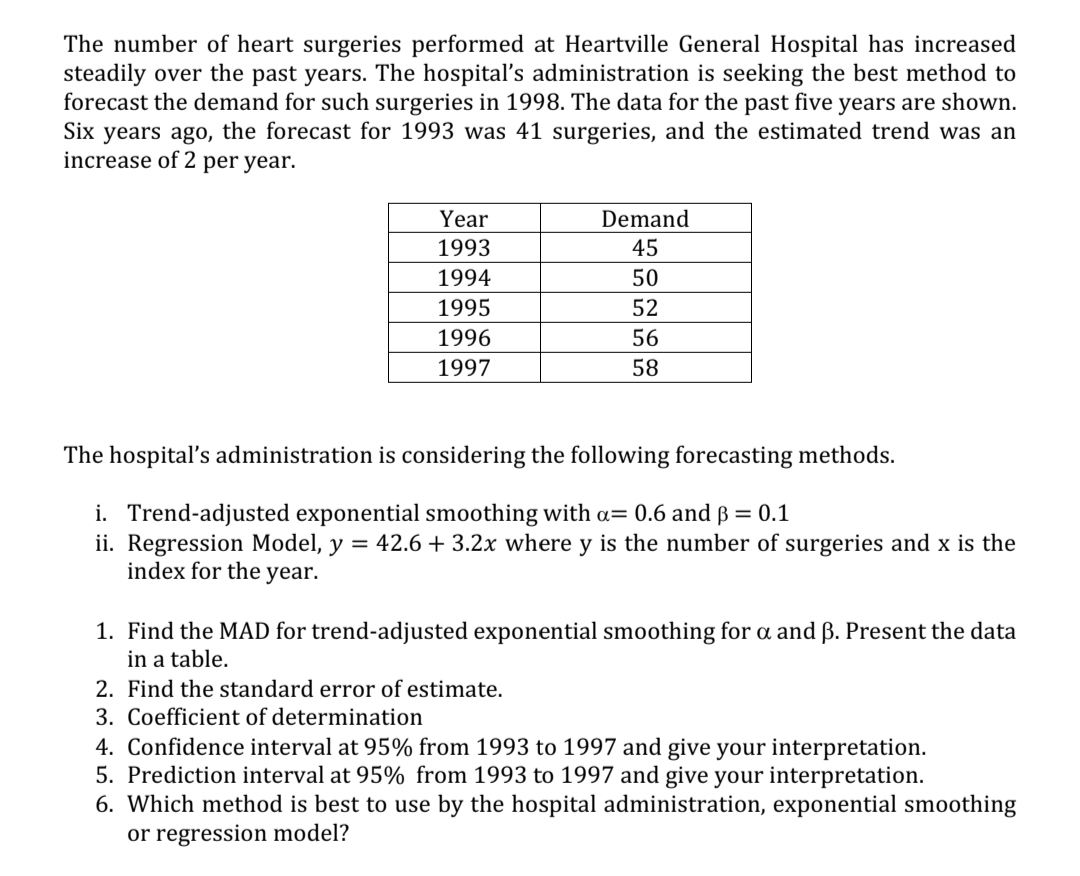
Transcribed Image Text:The number of heart surgeries performed at Heartville General Hospital has increased
steadily over the past years. The hospital's administration is seeking the best method to
forecast the demand for such surgeries in 1998. The data for the past five years are shown.
Six years ago, the forecast for 1993 was 41 surgeries, and the estimated trend was an
increase of 2 per year.
Year
Demand
1993
45
1994
50
1995
52
1996
56
1997
58
The hospital's administration is considering the following forecasting methods.
i. Trend-adjusted exponential smoothing with a= 0.6 and ß = 0.1
ii. Regression Model, y = 42.6 + 3.2x where y is the number of surgeries and x is the
index for the year.
1. Find the MAD for trend-adjusted exponential smoothing for a and ß. Present the data
in a table.
2. Find the standard error of estimate.
3. Coefficient of determination
4. Confidence interval at 95% from 1993 to 1997 and give your interpretation.
5. Prediction interval at 95% from 1993 to 1997 and give your interpretation.
6. Which method is best to use by the hospital administration, exponential smoothing
or regression model?
Expert Solution
This question has been solved!
Explore an expertly crafted, step-by-step solution for a thorough understanding of key concepts.

This is a popular solution!

Trending now
This is a popular solution!

Step by step
Solved in 2 steps

Recommended textbooks for you
Linear Algebra: A Modern Introduction
Algebra
ISBN:
9781285463247
Author:
David Poole
Publisher:
Cengage Learning
Linear Algebra: A Modern Introduction
Algebra
ISBN:
9781285463247
Author:
David Poole
Publisher:
Cengage Learning