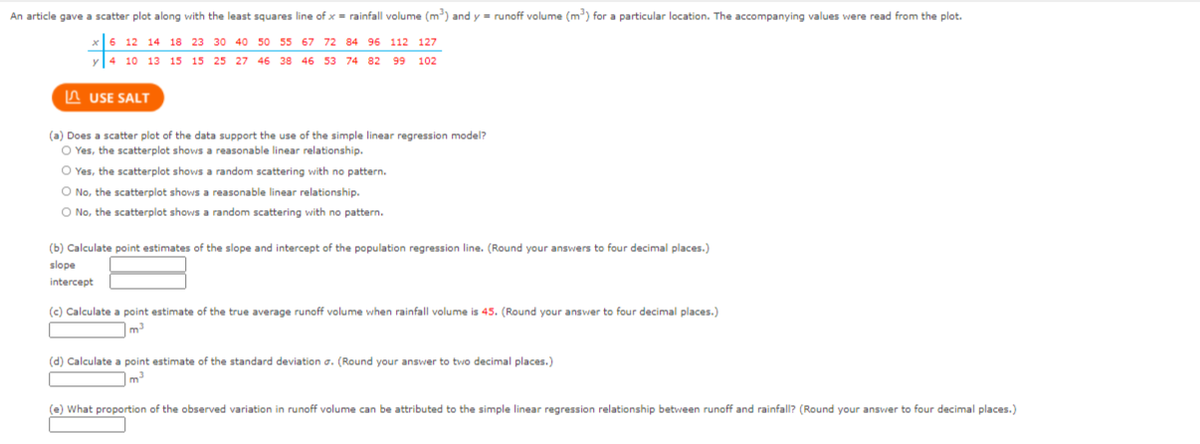
An article gave a scatter plot along with the least squares line of x = rainfall volume (m) and y - runoff volume (m) for a particular location. The accompanying values were read from the plot. 12 14 18 23 30 40 50 55 67 72 84 96 112 127 10 13 15 15 25 27 46 38 46 53 74 82 99 102 n USE SALT (a) Does a scatter plot of the data support the use of the simple linear regression model? O Yes, the scatterplot shows a reasonable linear relationship. O Yes, the scatterplot shovws a random scattering with no pattern. O No, the scatterplot shows a reasonable linear relationship. O No, the scatterplot shows a random scattering with no pattern. (b) Calculate point estimates of the slope and intercept of the population regression line. (Round your answers to four decimal places.) slope intercept (c) Calculate a point estimate of the true average runoff volume when rainfall volume is 45. (Round your answer to four decimal places.) m3 (d) Calculate a point estimate of the standard deviation a. (Round your answer to two decimal places.) m (e) What proportion of the observed variation in runoff volume can be attributed to the simple linear regression relationship between runoff and rainfall? (Round your answer to four decimal places.)

Elementary Linear Algebra (MindTap Course List)
8th Edition
ISBN:9781305658004
Author:Ron Larson
Publisher:Ron Larson
Chapter2: Matrices
Section2.CR: Review Exercises
Problem 90CR
icon
Related questions
icon
Concept explainers
Question
An article gave a scatter plot along with the least squares line of x= rainfall volume (m) and y - runoff volume (m) for a particular location. The accompanying values were read from the plot.
12 14 18 23 30 40 50 55 67 72 84 96 112 127
4 10 13 15 15 25 27 46 38 46 53 74 82 99
102
A USE SALT
(a) Does a scatter plot of the data support the use of the simple linear regression model?
O Yes, the scatterplot shows a reasonable linear relationship.
O Yes, the scatterplot shows a random scattering with no pattern.
O No, the scatterplot shows a reasonable linear relationship.
O No, the scatterplot shows a random scattering with no pattern.
(b) Calculate point estimates of the slope and intercept of the population regression line. (Round your answers to four decimal places.)
slope
intercept
(c) Calculate a point estimate of the true average runoff volume when rainfall volume is 45. (Round your answer to four decimal places.)
m
(d) Calculate a point estimate of the standard deviation a. (Round your answer to two decimal places.)
(e) What proportion of the observed variation in runoff volume can be attributed to the simple linear regression relationship between runoff and rainfall? (Round your answer to four decimal places.)
Transcribed Image Text:An article gave a scatter plot along with the least squares line of x= rainfall volume (m) and y - runoff volume (m) for a particular location. The accompanying values were read from the plot. 12 14 18 23 30 40 50 55 67 72 84 96 112 127 4 10 13 15 15 25 27 46 38 46 53 74 82 99 102 A USE SALT (a) Does a scatter plot of the data support the use of the simple linear regression model? O Yes, the scatterplot shows a reasonable linear relationship. O Yes, the scatterplot shows a random scattering with no pattern. O No, the scatterplot shows a reasonable linear relationship. O No, the scatterplot shows a random scattering with no pattern. (b) Calculate point estimates of the slope and intercept of the population regression line. (Round your answers to four decimal places.) slope intercept (c) Calculate a point estimate of the true average runoff volume when rainfall volume is 45. (Round your answer to four decimal places.) m (d) Calculate a point estimate of the standard deviation a. (Round your answer to two decimal places.) (e) What proportion of the observed variation in runoff volume can be attributed to the simple linear regression relationship between runoff and rainfall? (Round your answer to four decimal places.)
Expert Solution
trending now

Trending now

This is a popular solution!

steps

Step by step

Solved in 2 steps with 2 images

Blurred answer
Knowledge Booster
Correlation, Regression, and Association
Learn more about
Need a deep-dive on the concept behind this application? Look no further. Learn more about this topic, statistics and related others by exploring similar questions and additional content below.
Recommended textbooks for you
Elementary Linear Algebra (MindTap Course List)
Algebra
ISBN:
9781305658004
Author:
Ron Larson
Publisher:
Cengage Learning
Linear Algebra: A Modern Introduction
Algebra
ISBN:
9781285463247
Author:
David Poole
Publisher:
Cengage Learning