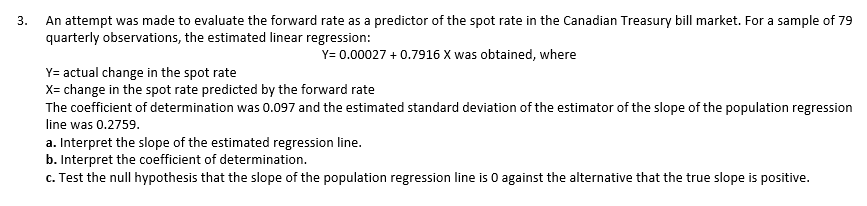
An attempt was made to evaluate the forward rate as a predictor of the spot rate in the Canadian Treasury bill market. For a sample of 79 quarterly observations, the estimated linear regression: Y= 0.00027 + 0.7916 X was obtained, where Y= actual change in the spot rate X= change in the spot rate predicted by the forward rate The coefficient of determination was 0.097 and the estimated standard deviation of the estimator of the slope of the population regression line was 0.2759. a. Interpret the slope of the estimated regression line. b. Interpret the coefficient of determination. c. Test the null hypothesis that the slope of the population regression line is 0 against the alternative that the true slope is positive.
An attempt was made to evaluate the forward rate as a predictor of the spot rate in the Canadian Treasury bill market. For a sample of 79 quarterly observations, the estimated linear regression: Y= 0.00027 + 0.7916 X was obtained, where Y= actual change in the spot rate X= change in the spot rate predicted by the forward rate The coefficient of determination was 0.097 and the estimated standard deviation of the estimator of the slope of the population regression line was 0.2759. a. Interpret the slope of the estimated regression line. b. Interpret the coefficient of determination. c. Test the null hypothesis that the slope of the population regression line is 0 against the alternative that the true slope is positive.

MATLAB: An Introduction with Applications
6th Edition
ISBN:9781119256830
Author:Amos Gilat
Publisher:Amos Gilat
Chapter1: Starting With Matlab
Section: Chapter Questions
Problem 1P

Related questions

Question
Thanks in advance!
Transcribed Image Text:An attempt was made to evaluate the forward rate as a predictor of the spot rate in the Canadian Treasury bill market. For a sample of 79
quarterly observations, the estimated linear regression:
Y= 0.00027 + 0.7916 X was obtained, where
Y= actual change in the spot rate
X= change in the spot rate predicted by the forward rate
The coefficient of determination was 0.097 and the estimated standard deviation of the estimator of the slope of the population regression
line was 0.2759.
a. Interpret the slope of the estimated regression line.
b. Interpret the coefficient of determination.
c. Test the null hypothesis that the slope of the population regression line is 0 against the alternative that the true slope is positive.
Expert Solution
This question has been solved!
Explore an expertly crafted, step-by-step solution for a thorough understanding of key concepts.

This is a popular solution!

Trending now
This is a popular solution!

Step by step
Solved in 4 steps with 3 images

Knowledge Booster


Learn more about
Need a deep-dive on the concept behind this application? Look no further. Learn more about this topic, statistics and related others by exploring similar questions and additional content below.Recommended textbooks for you
MATLAB: An Introduction with Applications
Statistics
ISBN:
9781119256830
Author:
Amos Gilat
Publisher:
John Wiley & Sons Inc

Probability and Statistics for Engineering and th…
Statistics
ISBN:
9781305251809
Author:
Jay L. Devore
Publisher:
Cengage Learning

Statistics for The Behavioral Sciences (MindTap C…
Statistics
ISBN:
9781305504912
Author:
Frederick J Gravetter, Larry B. Wallnau
Publisher:
Cengage Learning
MATLAB: An Introduction with Applications
Statistics
ISBN:
9781119256830
Author:
Amos Gilat
Publisher:
John Wiley & Sons Inc
Probability and Statistics for Engineering and th…
Statistics
ISBN:
9781305251809
Author:
Jay L. Devore
Publisher:
Cengage Learning
Statistics for The Behavioral Sciences (MindTap C…
Statistics
ISBN:
9781305504912
Author:
Frederick J Gravetter, Larry B. Wallnau
Publisher:
Cengage Learning

Elementary Statistics: Picturing the World (7th E…
Statistics
ISBN:
9780134683416
Author:
Ron Larson, Betsy Farber
Publisher:
PEARSON

The Basic Practice of Statistics
Statistics
ISBN:
9781319042578
Author:
David S. Moore, William I. Notz, Michael A. Fligner
Publisher:
W. H. Freeman

Introduction to the Practice of Statistics
Statistics
ISBN:
9781319013387
Author:
David S. Moore, George P. McCabe, Bruce A. Craig
Publisher:
W. H. Freeman