I need help with this

MATLAB: An Introduction with Applications
6th Edition
ISBN:9781119256830
Author:Amos Gilat
Publisher:Amos Gilat
Chapter1: Starting With Matlab
Section: Chapter Questions
Problem 1P

Related questions
Question
I need help with this
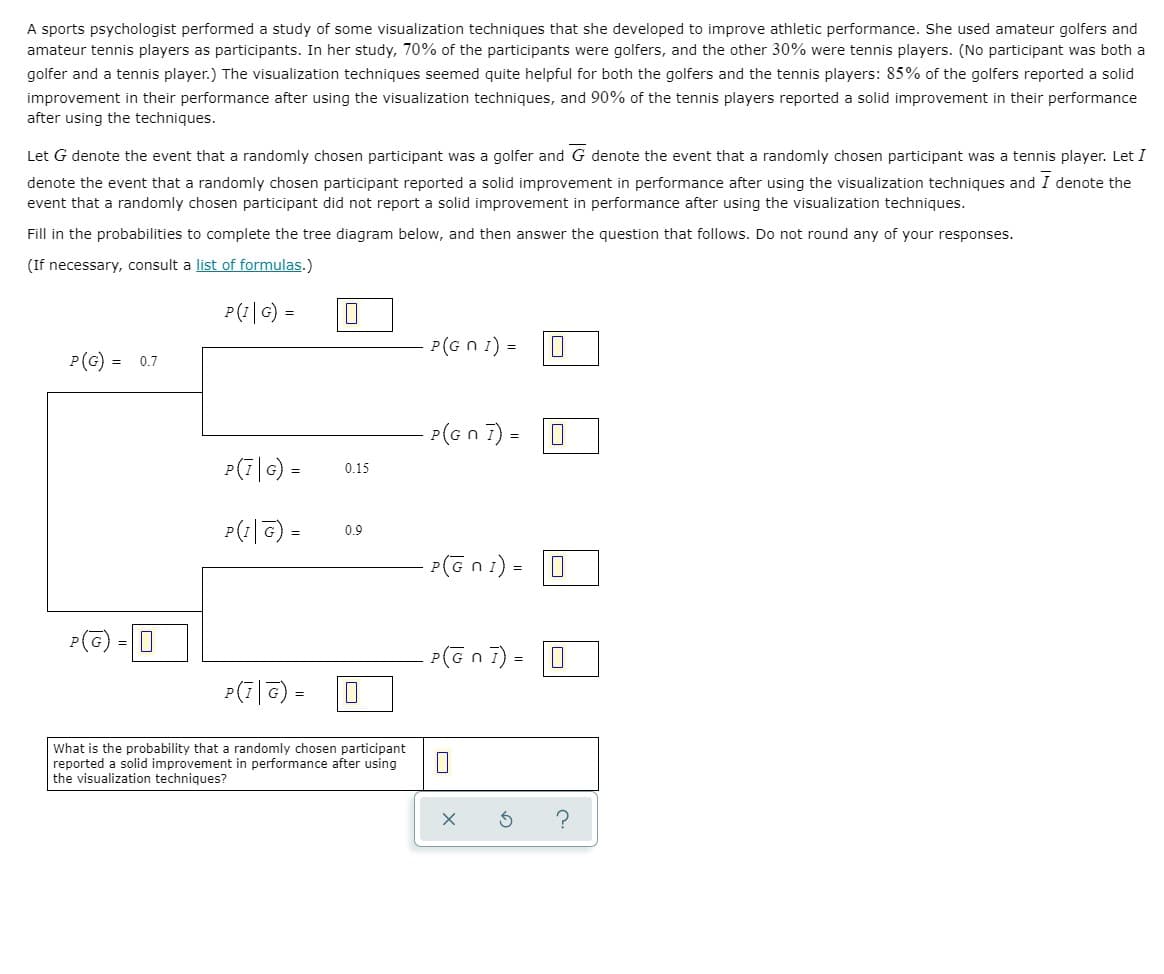
Transcribed Image Text:A sports psychologist performed a study of some visualization techniques that she developed to improve athletic performance. She used amateur golfers and
amateur tennis players as participants. In her study, 70% of the participants were golfers, and the other 30% were tennis players. (No participant was both a
golfer and a tennis player.) The visualization techniques seemed quite helpful for both the golfers and the tennis players: 85% of the golfers reported a solid
improvement in their performance after using the visualization techniques, and 90% of the tennis players reported a solid improvement in their performance
after using the techniques.
Let G denote the event that a randomly chosen participant was a golfer and G denote the event that a randomly chosen participant was a tennis player. Let I
denote the event that a randomly chosen participant reported a solid improvement in performance after using the visualization techniques and I denote the
event that a randomly chosen participant did not report a solid improvement in performance after using the visualization techniques.
Fill in the probabilities to complete the tree diagram below, and then answer the question that follows. Do not round any of your responses.
(If necessary, consult a list of formulas.)
P(i|G) =
P(G n 1)
=
P(G) =
0.7
P(G n 7)
P(7|6) :
0.15
P(1|6) :
0.9
- ?(Gn1) =
P(G)
=|||
P(G n 1) =
P(7|G)
What is the probability that a randomly chosen participant
reported a solid improvement in performance after using
the visualization techniques?
Expert Solution
This question has been solved!
Explore an expertly crafted, step-by-step solution for a thorough understanding of key concepts.

Step by step
Solved in 2 steps

Knowledge Booster


Learn more about
Need a deep-dive on the concept behind this application? Look no further. Learn more about this topic, statistics and related others by exploring similar questions and additional content below.Recommended textbooks for you
MATLAB: An Introduction with Applications
Statistics
ISBN:
9781119256830
Author:
Amos Gilat
Publisher:
John Wiley & Sons Inc

Probability and Statistics for Engineering and th…
Statistics
ISBN:
9781305251809
Author:
Jay L. Devore
Publisher:
Cengage Learning

Statistics for The Behavioral Sciences (MindTap C…
Statistics
ISBN:
9781305504912
Author:
Frederick J Gravetter, Larry B. Wallnau
Publisher:
Cengage Learning
MATLAB: An Introduction with Applications
Statistics
ISBN:
9781119256830
Author:
Amos Gilat
Publisher:
John Wiley & Sons Inc
Probability and Statistics for Engineering and th…
Statistics
ISBN:
9781305251809
Author:
Jay L. Devore
Publisher:
Cengage Learning
Statistics for The Behavioral Sciences (MindTap C…
Statistics
ISBN:
9781305504912
Author:
Frederick J Gravetter, Larry B. Wallnau
Publisher:
Cengage Learning

Elementary Statistics: Picturing the World (7th E…
Statistics
ISBN:
9780134683416
Author:
Ron Larson, Betsy Farber
Publisher:
PEARSON

The Basic Practice of Statistics
Statistics
ISBN:
9781319042578
Author:
David S. Moore, William I. Notz, Michael A. Fligner
Publisher:
W. H. Freeman

Introduction to the Practice of Statistics
Statistics
ISBN:
9781319013387
Author:
David S. Moore, George P. McCabe, Bruce A. Craig
Publisher:
W. H. Freeman