Anorexia nervosa is a serious eating disorder, particularly among young women. The data available below provide the weights, in pounds, of 17 anorexic young women before and after receiving a family therapy treatment for anorexia nervosa. Does family therapy appear to be effective in helping anorexic young women gain weight? Preliminary data analyses indicate that use of a paired t-test is reasonable. Perform the appropriate hypothesis test at the 5% significance level using the critical-value approach. Click here to view the data. Click here to view a table of critical values of t. What are the hypotheses for the t-test? Let population 1 be weights before therapy and let population 2 be weights after therapy. O A. Hg: H,> H2 Weights Before and After Therapy O B. Hg: H, = H2 OC. Họ H = 2 Before 82.7 After 85.4 81.9 86.1 96.5 89.5 91.7 97.4 D. Họ: H=2 79.0 86.7 76.4 93.5 72.9 79.9 77.9 100.5 75.8 101.0 97.2 73.5 78.1 81.0 83.2 81.5 97.7 93.6 90.3 77.1 82.9 89.3 85.4 88.6 92.7 91.9
Anorexia nervosa is a serious eating disorder, particularly among young women. The data available below provide the weights, in pounds, of 17 anorexic young women before and after receiving a family therapy treatment for anorexia nervosa. Does family therapy appear to be effective in helping anorexic young women gain weight? Preliminary data analyses indicate that use of a paired t-test is reasonable. Perform the appropriate hypothesis test at the 5% significance level using the critical-value approach. Click here to view the data. Click here to view a table of critical values of t. What are the hypotheses for the t-test? Let population 1 be weights before therapy and let population 2 be weights after therapy. O A. Hg: H,> H2 Weights Before and After Therapy O B. Hg: H, = H2 OC. Họ H = 2 Before 82.7 After 85.4 81.9 86.1 96.5 89.5 91.7 97.4 D. Họ: H=2 79.0 86.7 76.4 93.5 72.9 79.9 77.9 100.5 75.8 101.0 97.2 73.5 78.1 81.0 83.2 81.5 97.7 93.6 90.3 77.1 82.9 89.3 85.4 88.6 92.7 91.9

College Algebra (MindTap Course List)
12th Edition
ISBN:9781305652231
Author:R. David Gustafson, Jeff Hughes
Publisher:R. David Gustafson, Jeff Hughes
Chapter8: Sequences, Series, And Probability
Section8.7: Probability
Problem 58E: What is meant by the sample space of an experiment?

Related questions

Question
100%
I need to find test statistic, critical values, and whether or not it rejects if it falls under the rejection area.
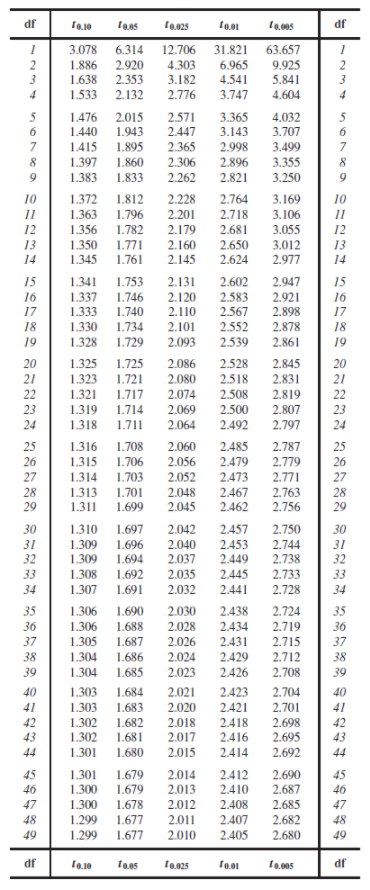
Transcribed Image Text:df
10.10
t0.025
10.01
10.005
df
3.078
6.314
12.706
31.821
6.965
63.657
2.920
2.353
2.
1.886
4.303
3.182
9.925
3
1.638
4.541
5.841
1.533
2.132
2.776
3.747
4.604
1.476
2.015
1.943
1.895
1.860
1.833
2.571
2.447
3.365
3.143
2.998
2.896
4.032
3.707
5
6.
1.440
6.
7
1.415
1.397
2.365
2.306
3.499
3.355
7
8.
8
9.
1.383
2.262
2.821
3.250
9.
10
1.372
1.812
2.228
2.764
3.169
3.106
3.055
10
11
1.363
1.796
2.201
2.718
11
1.356
1.782
2.179
2.160
2.145
12
2.681
12
13
1.350
1.345
1.771
1.761
2.650
2.624
3.012
13
14
2.977
14
15
16
1.341
1.337
1.753
2.131
2.602
2.583
2.567
2.552
2.539
2.947
2.921
15
16
1.746
2.120
17
1.333
1.740
2.110
2.898
17
18
1.330
2.878
1.734
1.729
2.101
18
19
1.328
2.093
2.861
19
20
1.325
1.725
2.086
2.528
2.845
20
21
1.323
1.721
1.717
2.080
2.518
2.831
2.819
21
22
1.321
2.074
2.508
22
23
1.319
1.714
2.069
2.500
2.807
23
24
1.318
1.711
2.064
2.492
2.797
24
25
1.316
1.708
2.060
2.485
2.787
25
26
1.315
1.706
2.056
2.479
2.473
2.467
2.462
2.779
26
27
27
1.314
2.052
1.703
1.701
2.771
28
29
28
29
1.313
2.048
2.763
1.311
1.699
2.045
2.756
30
1.697
2.042
2.040
2.037
2.035
1.310
2.457
2.750
30
31
1.309
1.696
2.453
2.744
31
32
33
1.309
1.694
2.449
2.738
2.733
2,728
32
33
1.308
1.692
2.445
34
1.307
1.691
2.032
2.441
34
35
1.306
1.690
2.030
2.438
2.724
2.719
2.715
35
36
1.306
1.688
2.028
2.434
36
37
1.305
1.687
2.026
2.431
37
38
1.304
1.686
1.685
2.024
2.023
2.429
2.712
2.708
38
39
1.304
2.426
39
40
1.303
1.684
2.021
2.423
2.704
40
41
1.303
2.020
1.683
1.682
1.681
2.421
2.701
41
1.302
1.302
42
2.018
2.418
2.698
42
43
2.017
2.015
2.416
2.695
2.692
43
44
1.301
1.680
2.414
44
2.014
2.013
45
2.412
2.410
2.690
2.687
1.301
1.679
1.679
45
46
1.300
46
47
1.300
1.678
2.012
2.408
2.685
47
48
1.299
1.677
2.011
2.407
2.682
48
49
1.299
1.677
2.010 2.405
2.680
49
df
1o.10
taes
t0.025
t0.005
df
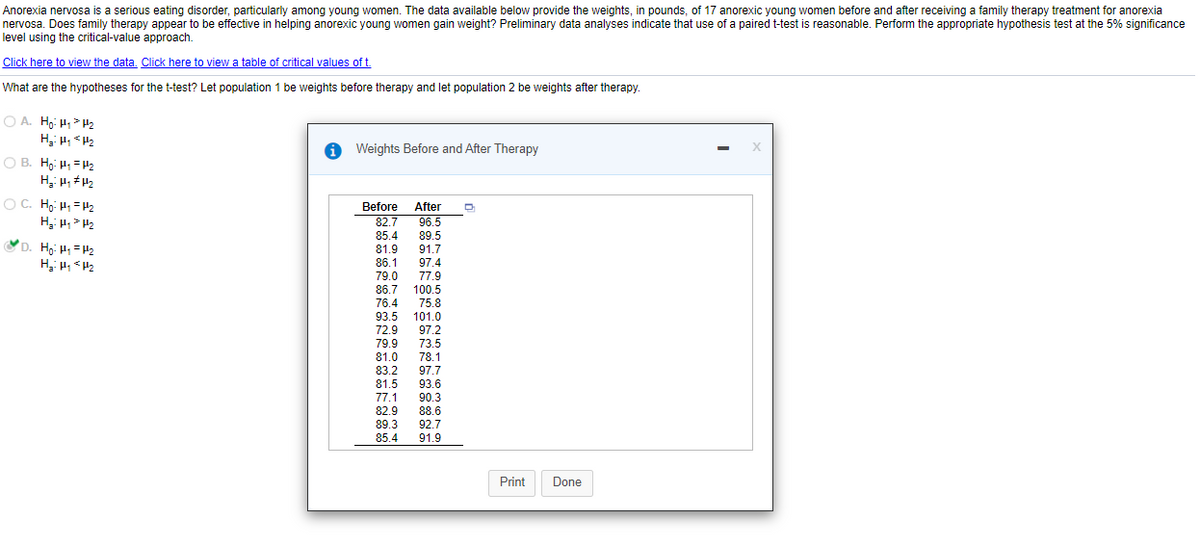
Transcribed Image Text:Anorexia nervosa is a serious eating disorder, particularly among young women. The data available below provide the weights, in pounds, of 17 anorexic young women before and after receiving a family therapy treatment for anorexia
nervosa. Does family therapy appear to be effective in helping anorexic young women gain weight? Preliminary data analyses indicate that use of a paired t-test is reasonable. Perform the appropriate hypothesis test at the 5% significance
level using the critical-value approach.
Click here to view the data. Click here to view a table of critical values of t.
What are the hypotheses for the t-test? Let population 1 be weights before therapy and let population 2 be weights after therapy.
O A. Ho: H> H2
1 Weights Before and After Therapy
O B. Hg: H1 = H2
OC. Hg: H1 = H2
Before
82.7
After
96.5
89.5
91.7
85.4
D. Hoi Hi =H2
81.9
86.1
97.4
79.0
86.7
77.9
100.5
76.4
75.8
93.5
72.9
79.9
101.0
97.2
73.5
78.1
81.0
83.2
97.7
81.5
93.6
77.1
90.3
82.9
88.6
89.3
92.7
85.4
91.9
Print
Done
Expert Solution
This question has been solved!
Explore an expertly crafted, step-by-step solution for a thorough understanding of key concepts.

This is a popular solution!

Trending now
This is a popular solution!

Step by step
Solved in 4 steps with 3 images

Knowledge Booster


Learn more about
Need a deep-dive on the concept behind this application? Look no further. Learn more about this topic, statistics and related others by exploring similar questions and additional content below.Recommended textbooks for you
College Algebra (MindTap Course List)
Algebra
ISBN:
9781305652231
Author:
R. David Gustafson, Jeff Hughes
Publisher:
Cengage Learning
College Algebra (MindTap Course List)
Algebra
ISBN:
9781305652231
Author:
R. David Gustafson, Jeff Hughes
Publisher:
Cengage Learning