Assume your utility over income is U=T and you have a 10% chance of getting sick. Your income when sick is $0 and your income when healthy is $100. 1. Graph your utility and income with income on the x-axis and utility on the y-axis. Show your income/utility when healthy and sick on the graph. 2. calculate your expected income. Show on graph. 3. calculate your expected utility. Show on graph. 1. Now you are offerred health insurance by Prof. Grossman's Totally Full and Fair Insurance Company. For a premium of $20, you will get a payout of $50 if you get sick. 1. Is the insurance company's name accurate (is this actuarially fair and full)? 2. What is the expected payout from this insurance? 3. What is the Income when sick and income when healthy under insurance? Show on your graph 4. What is the expected income and expected utility under this insurance? Show each on your graph 5. Propose a full and fair insurance given your 10% chance of getting sick and your healthy and sick incomes. 1. What is the premium and payout, show on the graph your utility in this situation.
Assume your utility over income is U=T and you have a 10% chance of getting sick. Your income when sick is $0 and your income when healthy is $100. 1. Graph your utility and income with income on the x-axis and utility on the y-axis. Show your income/utility when healthy and sick on the graph. 2. calculate your expected income. Show on graph. 3. calculate your expected utility. Show on graph. 1. Now you are offerred health insurance by Prof. Grossman's Totally Full and Fair Insurance Company. For a premium of $20, you will get a payout of $50 if you get sick. 1. Is the insurance company's name accurate (is this actuarially fair and full)? 2. What is the expected payout from this insurance? 3. What is the Income when sick and income when healthy under insurance? Show on your graph 4. What is the expected income and expected utility under this insurance? Show each on your graph 5. Propose a full and fair insurance given your 10% chance of getting sick and your healthy and sick incomes. 1. What is the premium and payout, show on the graph your utility in this situation.

Managerial Economics: A Problem Solving Approach
5th Edition
ISBN:9781337106665
Author:Luke M. Froeb, Brian T. McCann, Michael R. Ward, Mike Shor
Publisher:Luke M. Froeb, Brian T. McCann, Michael R. Ward, Mike Shor
Chapter19: The Problem Of Adverse Selection
Section: Chapter Questions
Problem 7MC

Related questions
Question
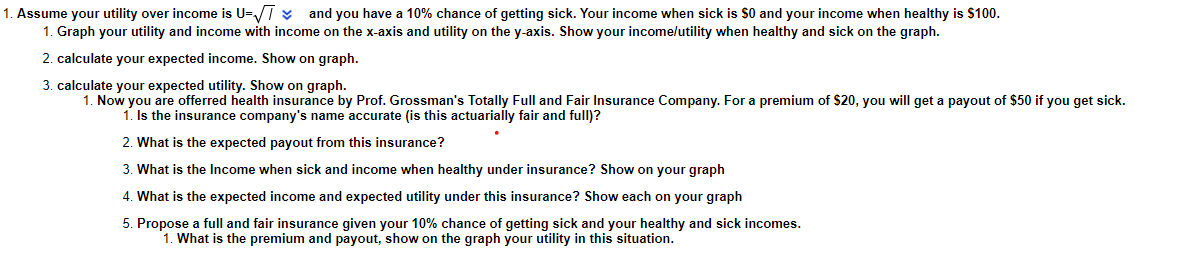
Transcribed Image Text:and you have a 10% chance of getting sick. Your income when sick is $0 and your income when healthy is $100.
1. Assume your utility over income is U=T ¥
1. Graph your utility and income with income on the x-axis and utility on the y-axis. Show your income/utility when healthy and sick on the graph.
2. calculate your expected income. Show on graph.
3. calculate your expected utility. Show on graph.
1. Now you are offerred health insurance by Prof. Grossman's Totally Full and Fair Insurance Company. For a premium of $20, you will get a payout of $50 if you get sick.
1. Is the insurance company's name accurate (is this actuarially fair and full)?
2. What is the expected payout from this insurance?
3. What is the Income when sick and income when healthy under insurance? Show on your graph
4. What is the expected income and expected utility under this insurance? Show each on your graph
5. Propose a full and fair insurance given your 10% chance of getting sick and your healthy and sick incomes.
1. What is the premium and payout, show on the graph your utility in this situation.
Expert Solution
Step 1
"Since you have asked multiple questions, we will solve the first question for you. If you want any specific question to be solved, please repost only that question"
Given:
The utility function over income is:
Chance of getting sick = 10%
Income when sick = $0
Income when healthy = $100
To Find:
- The expected utility:
- The expected income:
- Graph the utility and income with income on the x-axis and utility on the y-axis. Show your income/utility when healthy and sick on the graph.

Trending now
This is a popular solution!

Step by step
Solved in 3 steps with 1 images

Knowledge Booster


Learn more about
Need a deep-dive on the concept behind this application? Look no further. Learn more about this topic, economics and related others by exploring similar questions and additional content below.Recommended textbooks for you
Managerial Economics: A Problem Solving Approach
Economics
ISBN:
9781337106665
Author:
Luke M. Froeb, Brian T. McCann, Michael R. Ward, Mike Shor
Publisher:
Cengage Learning
Managerial Economics: A Problem Solving Approach
Economics
ISBN:
9781337106665
Author:
Luke M. Froeb, Brian T. McCann, Michael R. Ward, Mike Shor
Publisher:
Cengage Learning