Assuming that the population is normally distributed, construct a 95% confidence interval estimate for the population mean for each of the following samples: Sample A: 1, 1, 1, 1, 8, 8, 8, 8 Sample B: 1, 2, 3, 4, 5, 6, 7, 8 Explain why these two samples produce different confidence intervals even though they have the same mean and range.
Assuming that the population is normally distributed, construct a 95% confidence interval estimate for the population mean for each of the following samples: Sample A: 1, 1, 1, 1, 8, 8, 8, 8 Sample B: 1, 2, 3, 4, 5, 6, 7, 8 Explain why these two samples produce different confidence intervals even though they have the same mean and range.

Glencoe Algebra 1, Student Edition, 9780079039897, 0079039898, 2018
18th Edition
ISBN:9780079039897
Author:Carter
Publisher:Carter
Chapter10: Statistics
Section10.5: Comparing Sets Of Data
Problem 13PPS

Related questions
Question
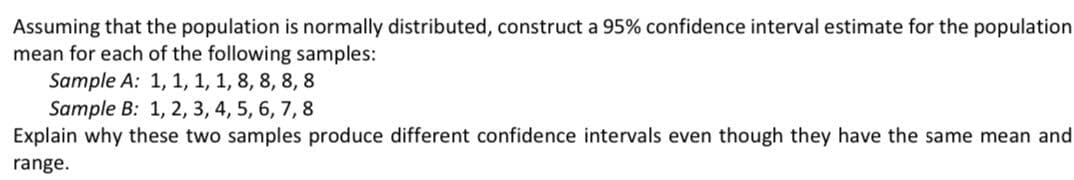
Transcribed Image Text:Assuming that the population is normally distributed, construct a 95% confidence interval estimate for the population
mean for each of the following samples:
Sample A: 1, 1, 1, 1, 8, 8, 8, 8
Sample B: 1, 2, 3, 4, 5, 6, 7, 8
Explain why these two samples produce different confidence intervals even though they have the same mean and
range.
Expert Solution
This question has been solved!
Explore an expertly crafted, step-by-step solution for a thorough understanding of key concepts.

This is a popular solution!

Trending now
This is a popular solution!

Step by step
Solved in 5 steps with 17 images

Recommended textbooks for you
Glencoe Algebra 1, Student Edition, 9780079039897…
Algebra
ISBN:
9780079039897
Author:
Carter
Publisher:
McGraw Hill
Glencoe Algebra 1, Student Edition, 9780079039897…
Algebra
ISBN:
9780079039897
Author:
Carter
Publisher:
McGraw Hill