Ecology: Habitat Wetlands offer a diversity of benefits. They provide a habitat for wildlife, spawning grounds for U.S. commercial fish, and renewable timber resources. In the last 200 years, the United States has lost more than half its wetlands. Environmental Almanac gives the percentage of wetlands lost in each state in the last 200 years. For the lower 48 states, the percentage loss of wetlands per state is as follows: 46 37 36 42 81 87 52 24 27 38 27 91 46 9 54 28 35 23 90 72 85 49 48 38 60 46 87 89 67 Make a stem-and-leaf display of these data. Be sure to indicate the scale. How are the percentages distributed? Is the distribution skewed? Are there any gaps? 20 56 73 59 39 74 30 33 50 49 52 42 59 50 35 56 50 31 35
Ecology: Habitat Wetlands offer a diversity of benefits. They provide a habitat for wildlife, spawning grounds for U.S. commercial fish, and renewable timber resources. In the last 200 years, the United States has lost more than half its wetlands. Environmental Almanac gives the percentage of wetlands lost in each state in the last 200 years. For the lower 48 states, the percentage loss of wetlands per state is as follows: 46 37 36 42 81 87 52 24 27 38 27 91 46 9 54 28 35 23 90 72 85 49 48 38 60 46 87 89 67 Make a stem-and-leaf display of these data. Be sure to indicate the scale. How are the percentages distributed? Is the distribution skewed? Are there any gaps? 20 56 73 59 39 74 30 33 50 49 52 42 59 50 35 56 50 31 35

MATLAB: An Introduction with Applications
6th Edition
ISBN:9781119256830
Author:Amos Gilat
Publisher:Amos Gilat
Chapter1: Starting With Matlab
Section: Chapter Questions
Problem 1P

Related questions
Question
Answer number 2. Make sure to show work!!!
Transcribed Image Text:State
Alabama
Alaska
Arizona
Arkansas.
California
Colorado
Connecticut
Delaware
Dist. of Columbia
Florida
Georgia
Hawaii
Idaho
Indiana
Illinois
lowa
Kansas
No. of
Hospitals
119
16
61
88
440
71
35
8
11
227
162
19
41
113
209
123
133
Average
Length
of Stay
7.0
5.7
5.5
7.0
6.0
6.8
7.4
6.8
7.5
7.0
7.2
9.4
7.1
6.6
7.3
8.4
7.8
(a) Make a stem-and-leaf display for these data.
(b) Interpretation Consider the following quote from Baron von Richthofen
in his Cattle Raising on the Plains of North America: "Cowboys are to be
found among the sons of the best families. The truth is probably that most
were not a drunken, gambling lot, quick to draw and fire their pistols."
Does the data distribution of longevity lend credence to this quote?
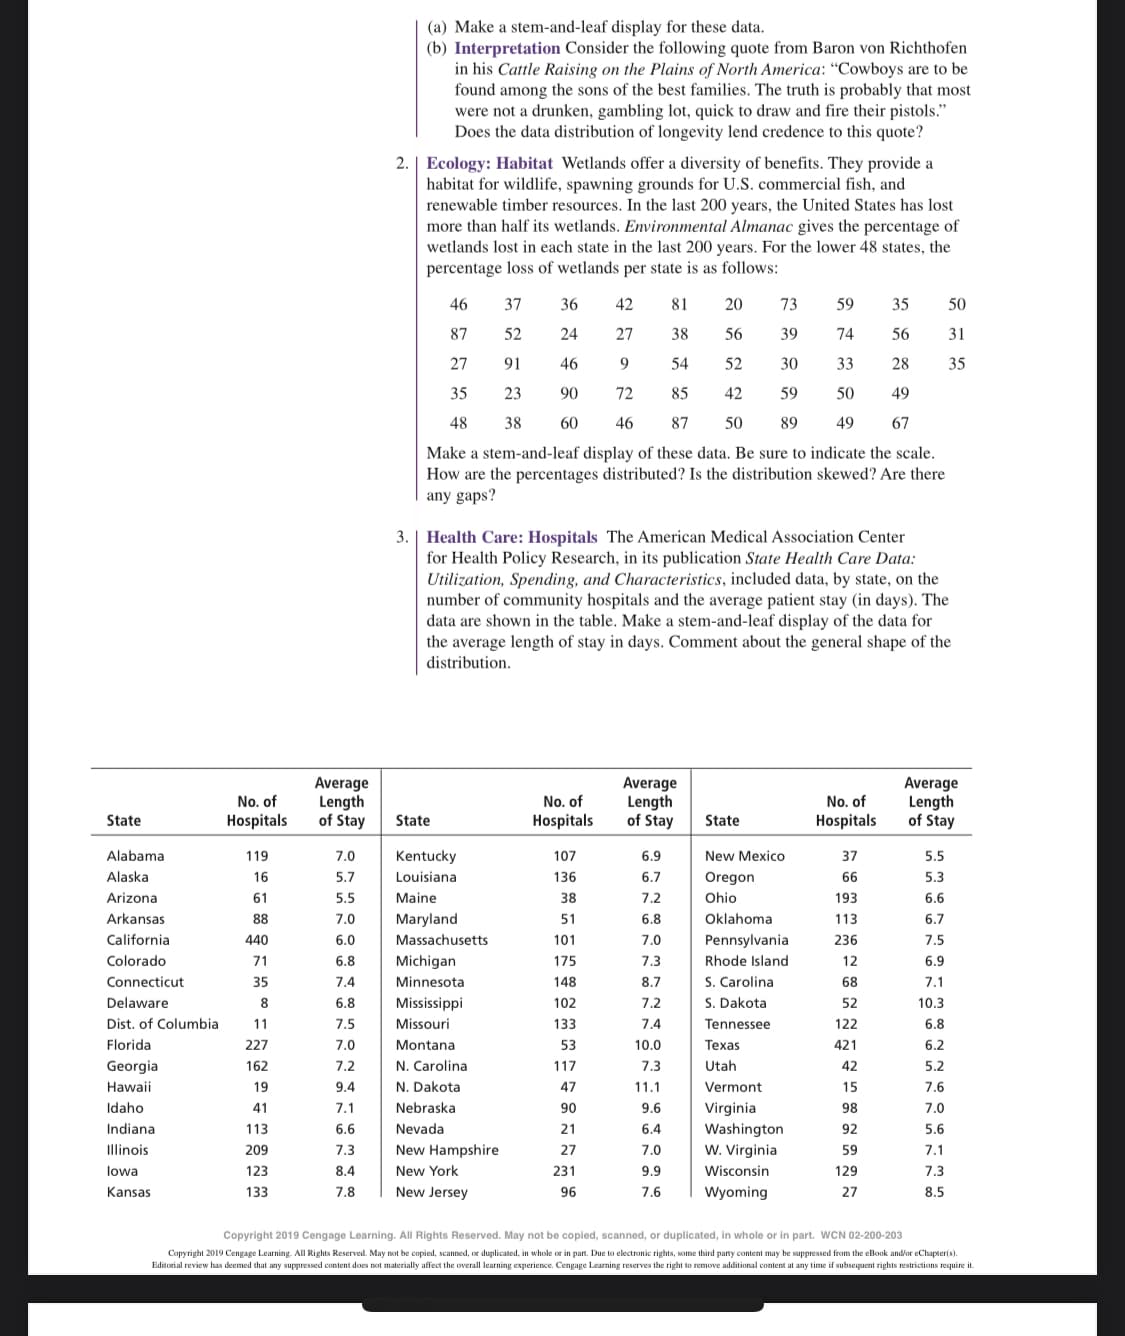
2. Ecology: Habitat Wetlands offer a diversity of benefits. They provide a
habitat for wildlife, spawning grounds for U.S. commercial fish, and
renewable timber resources. In the last 200 years, the United States has lost
more than half its wetlands. Environmental Almanac gives the percentage of
wetlands lost in each state in the last 200 years. For the lower 48 states, the
percentage loss of wetlands per state is as follows:
3.
81
20 73
38
56
39
54 52
30
33
72
85 42
59 50
46 87 50 89 49
Make a stem-and-leaf display of these data. Be sure to indicate the scale.
How are the percentages distributed? Is the distribution skewed? Are there
any gaps?
46
37
87
52
27
91
35
23
48 38
State
Kentucky
Louisiana
Maine
Maryland
Massachusetts
Health Care: Hospitals The American Medical Association Center
for Health Policy Research, in its publication State Health Care Data:
Utilization, Spending, and Characteristics, included data, by state, on the
number of community hospitals and the average patient stay (in days). The
data are shown in the table. Make a stem-and-leaf display of the data for
the average length of stay in days. Comment about the general shape of the
distribution.
Michigan
Minnesota
Mississippi
Missouri
Montana
N. Carolina
N. Dakota
36 42
24
27
46
9
90
60
Nebraska
Nevada
New Hampshire
New York
New Jersey
No. of
Hospitals
107
136
38
51
101
175
148
102
133
53
117
47
90
21
27
231
96
Average
Length
of Stay
6.9
6.7
7.2
6.8
7.0
7.3
8.7
7.2
7.4
10.0
7.3
11.1
9.6
6.4
7.0
9.9
7.6
State
New Mexico
Oregon
Ohio
Oklahoma
Pennsylvania
Rhode Island
S. Carolina
S. Dakota
Tennessee
Texas
Utah
Vermont
Virginia
Washington
W. Virginia
Wisconsin
Wyoming
59
74 56
28
49
67
35 50
31
35
No. of
Hospitals
37
66
193
113
236
12
68
52
122
421
42
15
98
92
59
129
27
Average
Length
of Stay
5.5
5.3
6.6
6.7
7.5
6.9
7.1
10.3
6.8
6.2
5.2
7.6
7.0
5.6
7.1
7.3
8.5
Copyright 2019 Cengage Learning. All Rights Reserved. May not be copied, scanned, or duplicated, in whole or in part. WCN 02-200-203
Copyright 2019 Cengage Learning. All Rights Reserved. May not be copied, scanned, or duplicated, in whole or in part. Due to electronic rights, some third party content may be suppressed from the eBook and/or eChapter(s).
Editorial review has deemed that any suppressed content does not materially affect the overall learning experience. Cengage Learning reserves the right to remove additional content at any time if subsequent rights restrictions require it.
Expert Solution
This question has been solved!
Explore an expertly crafted, step-by-step solution for a thorough understanding of key concepts.

This is a popular solution!

Trending now
This is a popular solution!

Step by step
Solved in 3 steps with 2 images

Recommended textbooks for you
MATLAB: An Introduction with Applications
Statistics
ISBN:
9781119256830
Author:
Amos Gilat
Publisher:
John Wiley & Sons Inc

Probability and Statistics for Engineering and th…
Statistics
ISBN:
9781305251809
Author:
Jay L. Devore
Publisher:
Cengage Learning

Statistics for The Behavioral Sciences (MindTap C…
Statistics
ISBN:
9781305504912
Author:
Frederick J Gravetter, Larry B. Wallnau
Publisher:
Cengage Learning
MATLAB: An Introduction with Applications
Statistics
ISBN:
9781119256830
Author:
Amos Gilat
Publisher:
John Wiley & Sons Inc
Probability and Statistics for Engineering and th…
Statistics
ISBN:
9781305251809
Author:
Jay L. Devore
Publisher:
Cengage Learning
Statistics for The Behavioral Sciences (MindTap C…
Statistics
ISBN:
9781305504912
Author:
Frederick J Gravetter, Larry B. Wallnau
Publisher:
Cengage Learning

Elementary Statistics: Picturing the World (7th E…
Statistics
ISBN:
9780134683416
Author:
Ron Larson, Betsy Farber
Publisher:
PEARSON

The Basic Practice of Statistics
Statistics
ISBN:
9781319042578
Author:
David S. Moore, William I. Notz, Michael A. Fligner
Publisher:
W. H. Freeman

Introduction to the Practice of Statistics
Statistics
ISBN:
9781319013387
Author:
David S. Moore, George P. McCabe, Bruce A. Craig
Publisher:
W. H. Freeman