АСTIVITY: 20- Consider a student who received $20 for his or her birthday. How could the funds be used? Create a PPC graph (at left) to show some of the 15+ student's choices. 1. Think of two school-appropriate categories for spending the total funds ($20). Place the categories on the blank graph, 10+ one on the X-axis, and one on the Y-axis. 2. Plot three or more combinations to show how the funds could be spent. Label them points A, B, and C. 3. Connect the points to create a line. Label the line "PPC." 4. Plot a point outside the PPC. Label it point F. 5. Explain why Point F cannot be reached. 10 15 20
АСTIVITY: 20- Consider a student who received $20 for his or her birthday. How could the funds be used? Create a PPC graph (at left) to show some of the 15+ student's choices. 1. Think of two school-appropriate categories for spending the total funds ($20). Place the categories on the blank graph, 10+ one on the X-axis, and one on the Y-axis. 2. Plot three or more combinations to show how the funds could be spent. Label them points A, B, and C. 3. Connect the points to create a line. Label the line "PPC." 4. Plot a point outside the PPC. Label it point F. 5. Explain why Point F cannot be reached. 10 15 20

Chapter2: Productions Possibilities, Opportunity Costs, And Economic Growth
Section: Chapter Questions
Problem 6SQP

Related questions
Question
100%
Transcribed Image Text:Introduction to the Production Possibilities Curve (PPC)
As you know, the basic economic problem is scarcity. Since we do not have enough scarce resources to satisfy
everyone's needs and wants, we all have to make choices. We must choose how to spend our time, our energy, our
money, and our material possessions, and for every choice that is made, a cost is suffered.
The relationship between choice and cost can be shown in a graph called a production possibilities curve, or PPC. For
example, consider a student who has 4 hours of free time in the evening. He or she can choose to spend some, all, or
none of those 4 hours studying for a test the following day. He or she could also use the time to catch up on sleep.
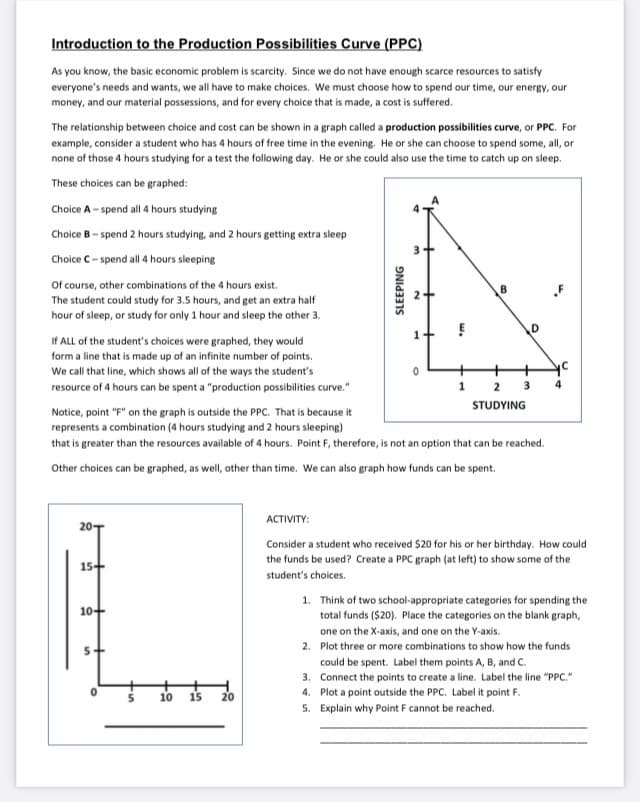
These choices can be graphed:
Choice A - spend all 4 hours studying
Choice B- spend 2 hours studying, and 2 hours getting extra sleep
Choice C- spend all 4 hours sleeping
Of course, other combinations of the 4 hours exist.
The student could study for 3.5 hours, and get an extra half
hour of sleep, or study for only 1 hour and sleep the other 3.
D
If ALL of the student's choices were graphed, they would
form a line that is made up of an infinite number of points.
We call that line, which shows all of the ways the student's
2 3
4.
resource of 4 hours can be spent a "production possibilities curve."
1
STUDYING
Notice, point "F" on the graph is outside the PPC. That is because it
represents a combination (4 hours studying and 2 hours sleeping)
that is greater than the resources available of 4 hours. Point F, therefore, is not an option that can be reached.
Other choices can be graphed, as well, other than time. We can also graph how funds can be spent.
АСTIVITY:
20-
Consider a student who received $20 for his or her birthday. How could
the funds be used? Create a PPC graph (at left) to show some of the
15+
student's choices.
1. Think of two school-appropriate categories for spending the
total funds ($20). Place the categories on the blank graph,
10+
one on the X-axis, and one on the Y-axis.
2. Plot three or more combinations to show how the funds
culd be spent. Label them points A, B, and C.
3. Connect the points to create a line. Label the line "PPC."
10
15
20
4. Plot a point outside the PPC. Label it point F.
5. Explain why Point F cannot be reached.
SLEEPING
Expert Solution
This question has been solved!
Explore an expertly crafted, step-by-step solution for a thorough understanding of key concepts.

This is a popular solution!

Trending now
This is a popular solution!

Step by step
Solved in 4 steps with 3 images

Knowledge Booster


Learn more about
Need a deep-dive on the concept behind this application? Look no further. Learn more about this topic, economics and related others by exploring similar questions and additional content below.Recommended textbooks for you


Essentials of Economics (MindTap Course List)
Economics
ISBN:
9781337091992
Author:
N. Gregory Mankiw
Publisher:
Cengage Learning
Essentials of Economics (MindTap Course List)
Economics
ISBN:
9781337091992
Author:
N. Gregory Mankiw
Publisher:
Cengage Learning

Brief Principles of Macroeconomics (MindTap Cours…
Economics
ISBN:
9781337091985
Author:
N. Gregory Mankiw
Publisher:
Cengage Learning

Principles of Microeconomics
Economics
ISBN:
9781305156050
Author:
N. Gregory Mankiw
Publisher:
Cengage Learning
