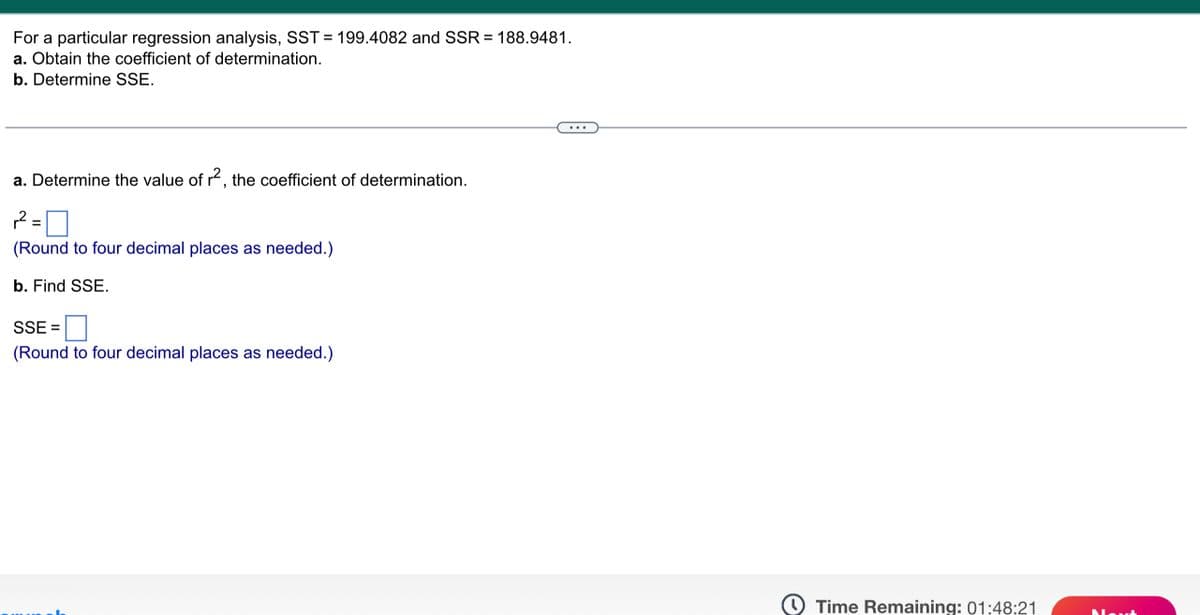
For a particular regression analysis, SST = 199.4082 and SSR = 188.9481. a. Obtain the coefficient of determination. b. Determine SSE.


Q: 1. Below are the are data for the number of visits to the campus recreation center during a semester…
A: Since you have posted multiple questions, we will solve the first question for you. If you want any…
Q: Researchers at Purdue University and Wichita State University found that airlines are doing a better…
A: There are two independent samples which are AirTran and Southwest. We have to test whether there is…
Q: A bag contains 10 Blue balls, 12 Red balls, and 15 Green balls. Two balls are going to be drawn from…
A: Blue balls = 10 Red balls = 12 Green balls = 15 Probability = favorable/total Clearly mentioned…
Q: with the total correlation between x and y = -.6 What's nature of total correlation between x and…
A: Given that: Corr(x,y)=-0.5Corr(z1,x)=0.5Corr(z2,x)=0.5Corr(z2,y)=0.2 We need to find the value of…
Q: You randomly select 20 cars of the same model that were sold at a car dealership and determine the…
A: Answer:- Given, Sample size, n = 20 Sample mean, X¯= 9.75 Sample standard deviation, S = 2.39…
Q: The U.S. Federal Seed Act establishes germination rates for various fruit and vegetable seeds.…
A: We have given that p̂ = 0.60 n = 12*10 = 120 Confidence level (c) = 95% = 0.95Significance level (α)…
Q: In Born together-Reared apart: the Landmark Minnesota twin study (2012), Nancy Segal discusses the…
A: The data set is given as- SAT Score no siblings SAT score with siblings 395 370 621 584…
Q: . Create and interpret a 95% confidence interval for the difference in the two servers population…
A: The data is given as- For server -1: n1=196x1¯ =12.5s12=9 For server-2: n2=225x2¯ =12.2s22=16
Q: Size of new televisions follow an unknown distribution with a mean/expectation of 65 inches and…
A: Mean(µ) = 65Standard deviations (σ) = 2.5 Sample size (n) = 25
Q: Consider the hypothesis test below. The following results are for independent samples taken from the…
A: The given values are n1=200,p¯1=0.25,n2=300,p¯2=0.11.
Q: Define the process X(t) = eaw (t)- za²t Use this process to answer the following problems. (a) Find…
A: In the given problem, the stochastic process represented by the equation: X(t)=exp[α×W(t)-α2t/2]…
Q: Let u denote the true average reaction time to a certain stimulus. For a z test of Ho: = 5 versus…
A: a) Suppose µ is the true population mean.
Q: Say we have an unknown distribution and we are interested in a confidence interval for the…
A: In this case, the objective is to derive the 0% confidence interval for the parameter μ.
Q: A probability distribution gives the possible values of the random variable and the probabilities of…
A: P(x=3)=0.046 P(x=4)=0.055 P(x=5)=0.035
Q: What is the z multiplier for a 70% confidence level? Round to the nearest 3rd decimal place, x.xxx
A: we have to find value of z multiplier used to construct 70% confidence interval.
Q: The following chart summarizes the complaints received at a catalogue sales call centre by day of…
A: The following chart summarizes the complaints received at a catalogue sales call centre by day of…
Q: Directions: Given a normal distribution with = μ 410 and o 50, compute for the corresponding z-value…
A: Mean=410 Standard deviations=50
Q: Question 1 "A manufacturer of shampoo claims that 72% of the shampoo users prefer brand X. To test…
A: The question is about hypo. testing Introduction : i ) The given example is of One sample prop. test…
Q: USA Today reports that the average expenditure on Valentine's Day was expected to be $100.89. Do…
A: The sample size for male consumers is 46 with sample mean 139.34 and for female is 30 with sample…
Q: 4. between 5. between z = ±2.16 6. to the right of z = 1.05 z = -2 and z= 3.13
A: X~N( 0 , 1 ) μ=0 , ?=1 (for standard normal distribution) Z-score =( x - μ )/? NOTE:-…
Q: Are the means for the final exams different for all statistics class delivery types? The table below…
A: Since you have posted a question with multiple sub-parts, we will solve first three sub- parts for…
Q: own distribution with mean/expectation 35 pounds and standard deviation 5 pounds. dom sample of 100…
A: Population mean μ =35 Population standard deviation =5 Sample size n =100
Q: You determined there was a positive correlation between the number of study hours a week a student…
A: Given, Regression equation is:- Y^=1.679 X +49 Here, X is the number of hours a…
Q: Question 7: Run a regression analysis on the following data set, where y is the final grade in a…
A: The question is about regression Given : To find : A ) Correlation coeffi. r B ) Regression eq. C…
Q: UCLA conducted a survey of more than 263,000 college freshmen from 385 colleges in fall 2005. The…
A: Since you have posted a question with multiple sub-parts, we will solve first three sub- parts for…
Q: The empirical rule estabilishes the percentages that are 1,2, and 3 deviations from the mean True…
A: Here, the given statement is Statement:- The empirical rule estabilishes the percentages that are…
Q: 3. A small business in Irvine that sells clothing makes roughly $35 per transaction. The CEO…
A: Sample size n =40 Sample mean=32.5 Standard deviation =2.5
Q: Sing Q In a certain town, 65% of the voters support a school referendum up for a vote. If 5 voters…
A: We have given that p = 0.65n = 5X ~Binomial(n, p) X ~ Binomial (5, 0.65)
Q: In Born together-Reared apart: the Landmark Minnesota twin study (2012), Nancy Segal discusses the…
A: Twins No Siblings Silblings 1 482 425 2 619 566 3 567 633 4 414 442 5 439 443 6 397 449…
Q: Match the following: e 30 students in that instructor's online class a mean time spent on a…
A: The objective is to define the correct interpretation for the provided statements by considering the…
Q: A researcher wants to know if the mean times (in minutes) that people watch their favorite news…
A: Since you have posted a question with multiple sub-parts, we will solve first three sub- parts for…
Q: Which of the following statements is/are TRUE? Select all that apply. If the regression errors are…
A: Homoscedasticity is the condition that the error term must have equal variance throughout he…
Q: IRSC INDIAN RIVER ~ 0 STATE COLLEGE Help I P(x) STA 2022.20222.1V.A.002 Flamentary Statietice I-…
A: The missing values are obtained below as follows: From the information, given that
Q: A researcher wants to know if the mean times (in minutes) that people watch their favorite news…
A: Since you have posted a question with multiple sub-parts, we will solve first three sub- parts for…
Q: (d) Compute the relative class frequency fin for each class in Table 2-9 and complete the partial…
A: In statistics, frequency is the number of times a data value occurs. These data values are often…
Q: A manufacturer claims that only 2% of their products are defective. A store receives a delivery of…
A: Given that a manufacturer claims that only 2% of their products are defective. A store receives a…
Q: I I I Step 1: Step 2: Step 3: Step 4: Step 5:
A: Need to provide the correct steps in data collection
Q: 1 Consider the experiment of selecting a playing card from a deck of 52 playing cards. Each card…
A: A deck of 52 cards each corresponding have a probability of 152
Q: Jocelyn believes that the amount of sleep she tends to get on weekends differs from the amount of…
A: School week : { 7,7.5,8,6.5,8,7.5,7,6.5,7,8 } N1 =10 df1 = N-1 = 9 Weekend : {…
Q: Dr. Victory is a child psychologist with an inner-city school district. He wants to estimate the…
A: The information provided in the question are as follows :- Margin of error (E)=0.08 And Confidence…
Q: Use the frequency histogram to complete the following parts. (a) Determine the number of classes.…
A: Solution (a) There are 7 classes (As there are 7 bars of the histogram) (b)…
Q: ou may want to use the Excel Two Means Calculator found in the Course to complete this problem. An…
A: Given Private Public Sample size 15 15 Average 97.60 84.3 SD 12.84 8.1
Q: "At a certain college, it is estimated that about 37% of the students have cars on campus, and with…
A: Suppose p is the true population proportion of students who have cars on campus.
Q: Here is the preference schedule for a recent election among four candidates: Number of voters 5 7 12…
A: Number of voters 5112027122 1st choice XAXKXDK 2nd choice A K D X K A A 3rd choice K D K…
Q: 6. A car dealer sold 750 automobiles last year. The following table categorizes the cars sold by…
A: The question is about probability Given : To find : a ) Prob. that a rand. selected car is red or…
Q: Test statistic = min {R1, R2} = 6.5 Critical value = 6 (from table) Since the test statistic is…
A: Test statistic = min {R1, R2} = 6.5 Critical value = 6 (from table)
Q: Consider the population model E[yi|Xi, Zi] = g(xi) + ziß for some function g(.). (This is referred…
A: Given Fact: E [ yi | xi , zi ] =g ( xi ) + ziβyi~=yi - E [ yi | xi ]zi~=zi - E [ zi | xi ]
Q: For Table 2, define the following point estimates: The mathematical expectation. On the variance.…
A: As per the honor code and guidelines we are supposed to solve three subparts. I request you to…
Q: 2) The marks obtained by nine Mathematical Studies SL students in their IAS (x) and their fincal IB…
A: First we have to find regression line…
Q: 4. Facebook wants to maximize the visibility of businesses on who advertise on their platform. This…
A: For new design: The sample size, n1=35; The sample mean, x¯1=15; The sample standard deviation,…

Step by step
Solved in 4 steps

- Find the equation of the regression line for the following data set. x 1 2 3 y 0 3 4Olympic Pole Vault The graph in Figure 7 indicates that in recent years the winning Olympic men’s pole vault height has fallen below the value predicted by the regression line in Example 2. This might have occurred because when the pole vault was a new event there was much room for improvement in vaulters’ performances, whereas now even the best training can produce only incremental advances. Let’s see whether concentrating on more recent results gives a better predictor of future records. (a) Use the data in Table 2 (page 176) to complete the table of winning pole vault heights shown in the margin. (Note that we are using x=0 to correspond to the year 1972, where this restricted data set begins.) (b) Find the regression line for the data in part ‚(a). (c) Plot the data and the regression line on the same axes. Does the regression line seem to provide a good model for the data? (d) What does the regression line predict as the winning pole vault height for the 2012 Olympics? Compare this predicted value to the actual 2012 winning height of 5.97 m, as described on page 177. Has this new regression line provided a better prediction than the line in Example 2?For the following exercises, use Table 4 which shows the percent of unemployed persons 25 years or older who are college graduates in a particular city, by year. Based on the set of data given in Table 5, calculate the regression line using a calculator or other technology tool, and determine the correlation coefficient. Round to three decimal places of accuracy
- The following fictitious table shows kryptonite price, in dollar per gram, t years after 2006. t= Years since 2006 0 1 2 3 4 5 6 7 8 9 10 K= Price 56 51 50 55 58 52 45 43 44 48 51 Make a quartic model of these data. Round the regression parameters to two decimal places.For the following exercises, consider the data in Table 5, which shows the percent of unemployed in a city ofpeople25 years or older who are college graduates is given below, by year. 41. Based on the set of data given in Table 7, calculatethe regression line using a calculator or othertechnology tool, and determine the correlationcoefficient to three decimal places.For the following exercises, consider the data in Table 5, which shows the percent of unemployed ina city of people 25 years or older who are college graduates is given below, by year. 40. Based on the set of data given in Table 6, calculate the regression line using a calculator or other technology tool, and determine the correlation coefficient to three decimal places.
- The following estimated regression equation based on 10 observations was presented. ŷ = 29.1260 + 0.5306x1 + 0.4680x2 The values of SST and SSR are 6,728.125 and 6,215.375, respectively. (a) Find SSE. SSE = (b) Compute R2. (Round your answer to three decimal places.) R2 = (c) Compute Ra2. (Round your answer to three decimal places.) Ra2 = (d) Comment on the goodness of fit. (For purposes of this exercise, consider a proportion large if it is at least 0.55.) The estimated regression equation provided a good fit as a small proportion of the variability in y has been explained by the estimated regression equation.The estimated regression equation did not provide a good fit as a small proportion of the variability in y has been explained by the estimated regression equation. The estimated regression equation provided a good fit as a large proportion of the variability in y has been explained by the estimated regression equation.The following estimated regression equation based on 30 observations was presented. ŷ = 17.6 + 3.8x1 − 2.3x2 + 7.6x3 + 2.7x4 The values of SST and SSR are 1,801 and 1,758, respectively. (a)Compute R2. (Round your answer to three decimal places.) R2 = (b)Compute Ra2.(Round your answer to three decimal places.) Ra2 = (c) Comment on the goodness of fit. (For purposes of this exercise, consider a proportion large if it is at least 0.55.) The estimated regression equation provided a good fit as a small proportion of the variability in y has been explained by the estimated regression equation.The estimated regression equation did not provide a good fit as a large proportion of the variability in y has been explained by the estimated regression equation. The estimated regression equation did not provide a good fit as a small proportion of the variability in y has been explained by the estimated regression equation.The estimated regression equation provided a good fit as a…The following estimated regression equation based on 30 observations was presented. ŷ = 17.6 + 3.8x1 − 2.3x2 + 7.6x3 + 2.7x4 The values of SST and SSR are 1,807 and 1,757, respectively. (a) Compute R2. (Round your answer to three decimal places.) R2 = (b) Compute Ra2. (Round your answer to three decimal places.) Ra2 = (c) Comment on the goodness of fit. (For purposes of this exercise, consider a proportion large if it is at least 0.55.) The estimated regression equation did not provide a good fit as a large proportion of the variability in y has been explained by the estimated regression equation. The estimated regression equation provided a good fit as a large proportion of the variability in y has been explained by the estimated regression equation. The estimated regression equation provided a good fit as a small proportion of the variability in y has been explained by the estimated regression equation. The estimated regression equation did not provide a good…
- Which of the following does not need to be computed to determine a simple regression line? SSx SP "Y-hat" SSyWhich of the following expressions is the correct way to express an interpretation for an OLS regression coefficient of -0.9? - This question is based on Data Analysis A. For every one unit increase in X there is - on average - a 0.9 unit decrease in Y. B. For every one unit increase in Y there is - on average - a 0.9 unit decrease in X. C. For every one unit increase in Y there is - on average - a 0.9 unit increase in X. D. For every one unit increase in X there is - on average - a 0.9 unit increase in Y.The following estimated regression equation based on 10 observations was presented. ŷ = 29.1670 + 0.5902x1 + 0.4960x2 Here, SST = 6,734.125, SSR = 6,212.375, sb1 = 0.0816, and sb2 = 0.0569. (a) Compute MSR and MSE. (Round your answers to three decimal places.) MSR=?? MSE=?? (b) Compute F and perform the appropriate F test. Use ? = 0.05. State the null and alternative hypotheses. H0: ?1 = ?2 = 0 Ha: One or more of the parameters is not equal to zero. H0: ?1 > ?2 Ha: ?1 ≤ ?2 H0: ?1 ≠ 0 and ?2 ≠ 0 Ha: One or more of the parameters is equal to zero. H0: ?1 < ?2 Ha: ?1 ≥ ?2 H0: ?1 ≠ 0 and ?2 = 0 Ha: ?1 = 0 and ?2 ≠ 0 Find the value of the test statistic. (Round your answer to two decimal places.) F = ?? Find the p-value. (Round your answer to three decimal places.) p-value = ?? State your conclusion. -Reject H0. There is sufficient evidence to conclude that the overall model is significant. -Do not reject H0.…


