(b) Use the table from part (a) to find u- (the mean of the sampling distribution of the sample mean) and o- (the standard deviation of the san distribution of the sample mean). Write your answers to two decmal places.
(b) Use the table from part (a) to find u- (the mean of the sampling distribution of the sample mean) and o- (the standard deviation of the san distribution of the sample mean). Write your answers to two decmal places.

Glencoe Algebra 1, Student Edition, 9780079039897, 0079039898, 2018
18th Edition
ISBN:9780079039897
Author:Carter
Publisher:Carter
Chapter10: Statistics
Section10.6: Summarizing Categorical Data
Problem 10CYU

Related questions
Question
Transcribed Image Text:(b)
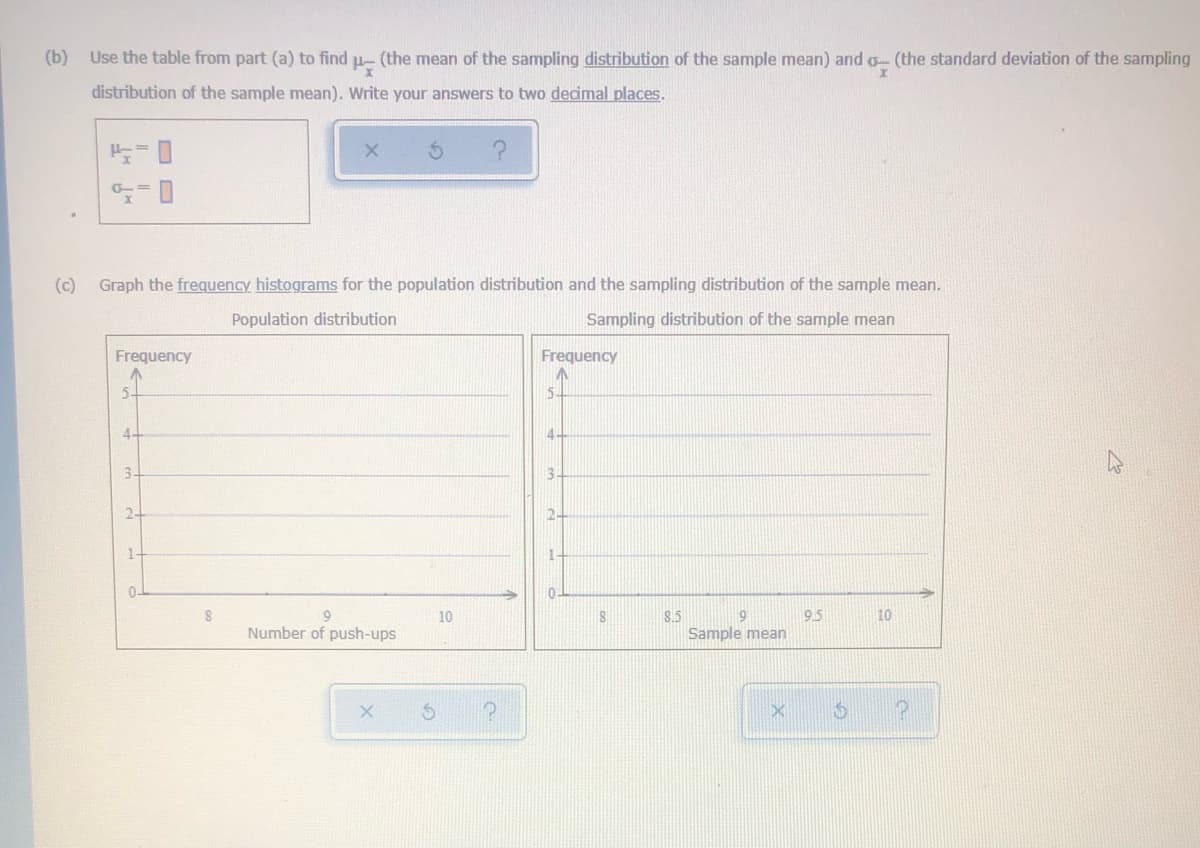
Use the table from part (a) to find u- (the mean of the sampling distribution of the sample mean) and o- (the standard deviation of the sampling
distribution of the sample mean). Write your answers to two decimal places.
(c)
Graph the frequency histograms for the population distribution and the sampling distribution of the sample mean.
Population distribution
Sampling distribution of the sample mean
Frequency
Frequency
5-
5.
4
3-
13
2-
1-
0-
9.
Number of push-ups
10
8.5
9.5
10
Sample mean
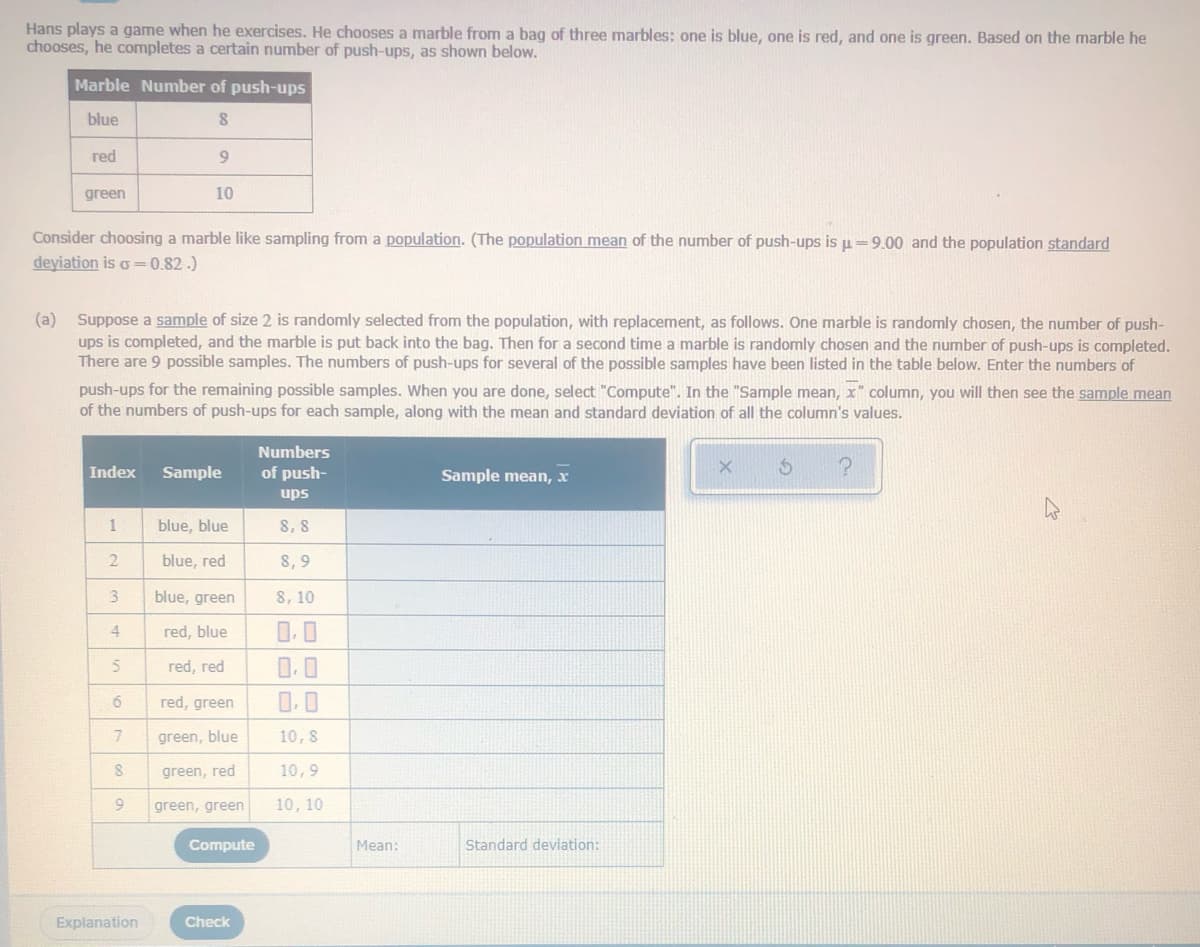
Transcribed Image Text:Hans plays a game when he exercises. He chooses a marble from a bag of three marbles: one is blue, one is red, and one is green. Based on the marble he
chooses, he completes a certain number of push-ups, as shown below.
Marble Number of push-ups
blue
red
green
10
Consider choosing a marble like sampling from a population. (The population mean of the number of push-ups is u=9.00 and the population standard
deyiation is o =0.82.)
(a) Suppose a sample of size 2 is randomly selected from the population, with replacement, as follows. One marble is randomly chosen, the number of push-
ups is completed, and the marble is put back into the bag. Then for a second time a marble is randomly chosen and the number of push-ups is completed.
There are 9 possible samples. The numbers of push-ups for several of the possible samples have been listed in the table below. Enter the numbers of
push-ups for the remaining possible samples. When you are done, select "Compute". In the "Sample mean, x" column, you will then see the sample mean
of the numbers of push-ups for each sample, along with the mean and standard deviation of all the column's values.
Numbers
Index
Sample
of push-
Sample mean, x
ups
blue, blue
8, 8
blue, red
8, 9
3.
blue, green
8, 10
4
red, blue
0.0
red, red
0.0
red, green
0.0
7
green, blue
10, 8
green, red
10,9
green, green
10, 10
Compute
Mean:
Standard deviation:
Explanation
Check
Expert Solution
This question has been solved!
Explore an expertly crafted, step-by-step solution for a thorough understanding of key concepts.

This is a popular solution!

Trending now
This is a popular solution!

Step by step
Solved in 3 steps

Recommended textbooks for you
Glencoe Algebra 1, Student Edition, 9780079039897…
Algebra
ISBN:
9780079039897
Author:
Carter
Publisher:
McGraw Hill

Big Ideas Math A Bridge To Success Algebra 1: Stu…
Algebra
ISBN:
9781680331141
Author:
HOUGHTON MIFFLIN HARCOURT
Publisher:
Houghton Mifflin Harcourt

Holt Mcdougal Larson Pre-algebra: Student Edition…
Algebra
ISBN:
9780547587776
Author:
HOLT MCDOUGAL
Publisher:
HOLT MCDOUGAL
Glencoe Algebra 1, Student Edition, 9780079039897…
Algebra
ISBN:
9780079039897
Author:
Carter
Publisher:
McGraw Hill
Big Ideas Math A Bridge To Success Algebra 1: Stu…
Algebra
ISBN:
9781680331141
Author:
HOUGHTON MIFFLIN HARCOURT
Publisher:
Houghton Mifflin Harcourt
Holt Mcdougal Larson Pre-algebra: Student Edition…
Algebra
ISBN:
9780547587776
Author:
HOLT MCDOUGAL
Publisher:
HOLT MCDOUGAL

College Algebra (MindTap Course List)
Algebra
ISBN:
9781305652231
Author:
R. David Gustafson, Jeff Hughes
Publisher:
Cengage Learning