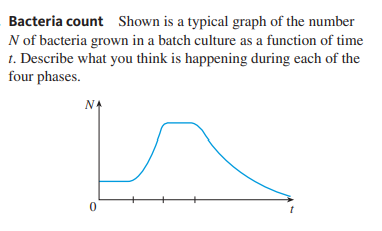
Bacteria count Shown is a typical graph of the number N of bacteria grown in a batch culture as a function of time 1. Describe what you think is happening during each of the four phases. NA


Q: One ml of a water sample was placed in a Petri dish with melted agar. After incubation, 129 colonies…
A: A colony-forming unit, or CFU, is a measurement of the concentration of microorganisms in a test…
Q: A bacterial culture contains 500 organisms / mL in the exponential growth phase at 8 am in the…
A: The exponential phase of bacterial growth is the phase when bacteria are actively dividing and…
Q: A culture of E. coli has a concentration of 5 x 10⁸ cells/mL. How many times do you have to dilute…
A: Given: 1. Number of colonies: 2502. No. of bacteria in culture: 5 X 10⁸ 3. Volume plated: 0.1 ml 4.…
Q: A medium containing an abundance of substrate was seeded with 20 mg/L VSS of an active mixed…
A: Biological culture is a common laboratory method for the study of living things. There are different…
Q: Experiment of batch fermentation of E. coli in a stirred tank bioreactor was carried out. 0.5g / L,…
A: Scale On X axis, 2cm= 0.5 hours On Y axis, 1cm= 0.02 OD
Q: Students in a microbiology lab are provided with a culture of E. coli, and don't know how long it's…
A: Bacterial growth is increase in the quantity of cellular constituents and number .It depends upon…
Q: A specimen transferred onto a fresh agar plate is initially in which phase of bacterial growth?
A:
Q: You perform a quadrant streak and isolate a single colony which contains two distinct species of…
A: Quadrant streaking is a technique for microbial inoculation in which a single colony is isolated on…
Q: Question attached
A: A colony-forming unit (CFU) is a unit that is used in microbiology to measure the viable number of…
Q: A bacterial culture contains 500 cells/mL in the exponential growth phase at 8 AM. If you onsider a…
A: Generation time is the time taken by bacteria to double their population. Here the given generation…
Q: Data Both plates were inoculated with the same 4 bacteria and in the same pattern, but were…
A: The bacterial growth is influenced by the presence or absence of oxygen and oxygen reduction…
Q: A culture of bacteria is found to have a DRT of 2 minutes. How long would it take to reduce the…
A: Heat is used for sterilization of those substances that can withstand it over longer periods or…
Q: A researcher is planning to plant antibiotic-resistant Escherichia coli pure bacteria sample in…
A: Culturing the bacteria on a solid media involves several steps in which the major step is…
Q: Refer to the provided image drawn by a student trying to plan out their serial dilution protocol.…
A: Colony forming unit (CFU)is a measure of viable bacterial cell. CFU/ml can be calculated using…
Q: Consider the given bacterial growth curve (X axis is time, Y axis is log number of viable cells). At…
A: The number of live cells in a bacterial population over time is represented by the bacterial growth…
Q: A microbiologist has isolated a new strain of bacteria, and is trying to characterize aspects of its…
A: Psychrophilic bacteria are cold loving bacteria that grows and reproduce at lower temperatures…
Q: A loopful of bacteria containing 1000 bacterial cells is inoculated into a nutrient broth and…
A: It is a multiple choice question.
Q: A bacterium has a generation time of 30 minutes. You transfer cells from an exponentially growing…
A: Bacteria are unicellular and prokaryotic organisms that live in wide variety of environments. It…
Q: Solve the following problem: 34,000 bacteria/l have been measured 4 hours after inoculating a…
A: Given information Bacterial population after 4 hours of inoculation= 34,000 bacteria/l Bacterial…
Q: .The image below shows the growth rate vs temperature profiles of two strains of bacteria. They…
A: In biology, membrane fluidity refers to the viscosity of the lipid bilayer of a cell membrane or a…
Q: Growth of an E. coli bacteria in batch culture is observed. The bacteria are fed with 0.5 g / L…
A: Bacteria are microorganisms that grow very fast. They almost double every 20 to 30 minutes.…
Q: typical labeled sketch of a bacterial growth curve in batch culture
A: Batch culture is a laboratory culture method in which bacteria has grown in large scale. Here…
Q: You spread 0.1 mL volume of a 10^(-6) dilution onto a nutrient agar plate. After 24 hours of…
A: Orignal colony (OCD) density is the actual number of bacterial colonies, which are present in a…
Q: Shown below is the growth of E. coli in nutrient agar plates after exposure to different doses of UV…
A: E.coli or Escherichia coli, is a rod shaped, coliform, gram negative bacteria which is facultative…
Q: A medium was inoculated with 5 * 106 cells/ml of Escherichiacoli cells. Following a 1-h lag, the…
A: Growth curves are generally the description of the density of cell populations in liquid culture…
Q: A student is performing a bacterial growth curve experiment. At t= 0 hrs, he inoculated 50 mL of the…
A:
Q: How does the streak plate technique help in isolating individual colonies of bacteria? Why streak…
A: NOTE: DUE TO MULTIPLE QUESTION POSTED, AS PER OUR GUIDELINES WE ARE ONLY SUPPOSED TO ANSWER THE…
Q: Suppose that you were tasked with 4 cultures of a specific Bacteria Species in Luria Broth medium:…
A:
Q: A bacterial culture contains 500 cells/mL in the exponential growth phase at 8 AM. If you consider a…
A: Bacterial growth is an orderly increase in the quantity of cellular constituents (cell mass) and…
Q: You spread 0.1 mL volume of a 10^(-6) dilution onto a nutrient agar plate. After 24 hours of…
A: The total number of colonies of bacteria is referred to as Total Viable count (TVC). The colonies…
Q: Shown below is the growth of E. coli in nutrient agar plates after exposure to different doses of UV…
A: Answer :- The given data infer the effect of increasing UV exposure time on E. coli. With an…
Q: Which of the answers below represents the correct mathematical expression of bacterial growth of…
A: The formula for bacterial growth is as follows: Nt = No × 2n Where Nt= bacterial population at time…
Q: When bacteria are grown under adverse conditions, i.e., in the presence of a poison such as an…
A: Introduction Bacteria are single-celled organisms with a small size. Bacteria can be found…
Q: The plates below were each created with 0.5 mL of culture from a 10-fold dilution series. Each plate…
A: Serial dilutions are utilised for the calculation of the concentration of microorganisms. Since it…
Q: A species of bacteria has a doubling time of 24 hours. After incubating the initial population for…
A: In vitro, under desirable situations, a growing bacterial population doubles at periodic intervals.…
Q: You were asked to prepare a dilution series of a bacterial culture where only 3 tubes will be used…
A: "Since you have asked multiple question, we will solve the first question for you. If you want any…
Q: A 24-hour broth culture of E coll is estimated to have 75x10 cells.If you were to do a plate count…
A: bacteria such as E.coli is known to divide every twenty minutes. This means the number of cells…
Q: You want to determine the amount of cells in a culture. You dilute the suspension to 10^-4 and…
A: For calculating the number of bacteria or microorganisms within a sample we usually used the serial…
Q: A pure bacterial culture of unknown concentration was diluted to determine the concentration of…
A: Viable plate count = 30 - 300 colonies
Q: Bacterial generation times for four different bacterial species were calculated in the media listed…
A: The time it takes for a population of bacteria to double in size is known as generation time. The…
Q: Tripling lime The number of bacteria in a colony increases at a rate propoJtional to the number…
A: Bacterial cells divide by binary fission. The generation time is defined as the doubling time of the…
Q: There are 10 mL of a culture of a bacteria at 104 cells/mL into 990 mL of the same broth at the same…
A: Introduction The growth curve of bacteria is the type of curve that tells us about the number of…
Q: Please answer fast Dilution Problem. A culture of Staphylococcus is diluted as follows: (1) 20mL…
A: CFUs are a measure of the number of progenitors present in a given population of cells; if an…
Q: Which of the following takes the LONGEST to kill a live culture of vegetative bacterial cells? a)…
A: A "microbe" is a living entity that is so tiny that it cannot be seen with the naked eye.…
Q: 1. Table 1 lists a typical recipe for growing bacteria in the lab. A researcher discovered a…
A: Microbiological media or bacterial culture media, is a growth medium used to grow bacteria. In other…
Q: A bacterium has a generation time of 30 minutes. You transfer cells from an exponentially growing…
A: The bacterial cell follows the development of new daughter cells by the division of DNA. In…
Q: Helicobacter pylori, a bacterium that causes stomach ulcers, can grow in medium with a pH above 5.…
A: Helicobacter pylori is the first formally recognized bacterial carcinogen and is one of the most…


Trending now
This is a popular solution!

Step by step
Solved in 2 steps

- If the temperature of the incubator were to be increased from 35 to 45°C, how would this affect the bacterial growth curve of E. coli? (optimum temperature 20o-40oC; most human pathogens)If you altered the conditions under which bacterial growth normally occurs (i.e. increase the temperature of incubating a culture from 35 to 40°C), what effect would this have on the bacterial growth curve of the organism under study?A new intestinal isolate of E. coli is known to have a generation time of 12 minutes. If a culture contained 3, 221,225,472 bacterial cells after 6 hrs how many bacteria must have been inoculated into the culture at time 0.
- You have just measured the OD of your E. coli (which is in log-phase growth) and it is at 0.15. You are doing a procedure that requires you to centrifuge E.coli once it reaches an OD of 1.20 do you have time to run to the bathroom? In other words, (i) explain the logic, and (ii) show the math to illustrate how you know what time you need to return to lab to centrifuge those bacterial cells.How many colonies would you expect to count at each 5-fold dilution (5-1 until 5-6), when you have 338,000 bacteria present per gram of a meat sample. Given you inoculate 1 mL of each of these dilutions.A sample of raw ground beef initially contained 25 E. Coli bacteria. After six hours, there are 102 400 cells in the sample. What is the growth rate of the E. coli population? Show all work. Express your answer using scientific notation in the form of xyz 10 d #bacteria/hr.
- Starting with 10 bacterial cells per milliliter in a sufficient amount of complete culture medium with a 1-hour lag phase and a 30-minute generation time, how many cells will there be in a liter of medium at the end of 2 hours? At the end of 7 hours? Show your solution.In an experiment to calculate the decimal reduction time for an Escherichia coli culture, viable cells were exposed to a constant temperature of 80°C for a set amount of time. After exposure, the remaining number of surviving cells were counted. Based on Table 1, what is the decimal reduction time?Table 1. Decimal Reduction Time for E. coli Heated to 80°C Total time of exposure (minutes): Number of Microbial Cells Present: 0 100 1 80 3 50 4 42 6.5 26 13 10 21 0If a culture of E. coli you are tracking grows from 5 x 10³ cells/ml to 9 x 10⁷ cells per ml in 4 hours, what is the approximate generation time of your E. coli? how can i slove this step by step a. About 14 minutesb. About 17 minutesc. About 20 minutesd. About 23 minutese. About 30 minutes
- A slant is inoculated with 100 E.coli cells. The slant is left at room temperature where the generation time is 1 hour. How many E. coli are on the slant in 6 hours? If the slant was initially put in the 37C incubator, with a 20 minute generation time, how many more cells would have grown in the same time period?Calculate the doubling time of a culture of E. coli that is started with 3x10⁵ CFU/mL and grows to 4.6x10⁸ CFU/mL in 3 hours. Be sure to use units in your answer.In the Messelsohn-Stahl experiment, there should be ______ band(s) in the centrifugation tube after two generations of bacterial growth in normal nitrogen. Group of answer choices None of these One light and one medium density Two light and heavy Three light bands One heavy