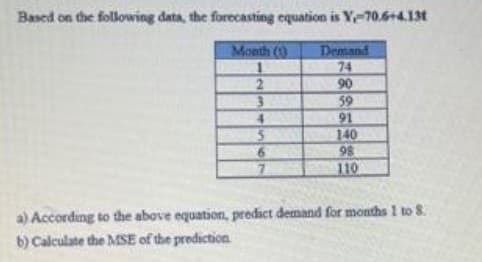
Based on the following data, the forecasting equation is Y-70.6+4.13t Month (0 Demand 74 90 59 91 140 98 110 6. 7. a) According to the above equation, predict demand for months 1 to 8 b) Calculate the MSE of the prediction


Q: Below is some of the regression output from a regression of the amount rental houses on an island…
A: Given Area of House=3900 square foot Find How much more (or less) does a 3900 square foot house that…
Q: From the prices of shares of x and y below find out which is more stable in value: 35 54 52 53 56 58…
A:
Q: A multiple regression analysis based on a data set that consists of 30 observations yielded the…
A: Given: P = $1000 I = $20000 A = $5000
Q: In a study of sales, a company obtained the following least square trend equation : 16 + 2X (Origin,…
A:
Q: 4. 10 12 14 16 18 2D 22 Number of hours worked Use the equation of the line of best fit, y = 1.84x +…
A: Here we are given a line that represent the relationship between 'x' and 'y' which is a linear…
Q: From the following data obtain the two regression equations. Sales 91 97 108 121 67 124 51 73 111 57…
A:
Q: (d) Determine the coefficient of determination for the model and interpret its meaning.
A:
Q: F. Solve the following problems 1. The amount of water discharged by the Davao River has changed…
A:
Q: Given the following data for demand at the XYZ Company, calculate the monthly forecast for 2003…
A: Forecast are used to determine the future value over a period of time. Error in forecast can be…
Q: Below is some of the regression output from a regression of the amount rental houses on an island…
A: Given, Price=1474 + 0.31*Size + 1885*View + 0.1*(Size*View) View=1 if it has an ocean front view0…
Q: Refer Excel Output and answer the following questions. 1. State multiple regression equation 2.…
A: The coefficients of intercept, Feet and large are given as -3.92,0.03 and 4.22 in the excel output.…
Q: Apply the 3-years moving average method to forecast the required demand for the year 2021 from the…
A: Solution : Given data is Years 2012 2013 2014 2015 2016 2017 2018 2019 2020 Demand 245 325 300…
Q: Write down the difference equations for the following population models, when time n is measured in…
A: Part(a): Let us assume that the population at any time n is P.
Q: The sales trend has been modeled as: Sales-2°t+200, where te time in quarters, beginning in Q1 2010.…
A: Here, The formula for the quarters is 2*t+200, t is the time in quarters beginning Q1 of 2010.
Q: Use the following data to answer the next five questions: Period Demand 1 63 2 68 3 74 4 77 5 62 6…
A: Given data: Period Demand 1 63 2 68 3 74 4 77 5 62 6 69 7 74 8 50
Q: Assume the following data came from a linear model, then answer the following questions 0.4 0.9 1.5…
A: Since you have posted a question with multiple sub-parts, we will solve the first three subparts for…
Q: Find the equation of the regression line from the following data. Price of a Commodity in RO 1 3…
A: Solution: Let X be the price of a commodity in RO and Y be the demand for the commodity. The given…
Q: The following chart is data over an 8-month period that shows how much a company spent in…
A: The data is x(advertising) y(sales) 900 56000 2700 89200 3150 98500 1300 54000 3400…
Q: The table shows the number of people in North America who use email as a part of their jobs. North…
A: (a) Make the table of values as shown below, Number of years (X) X2 Number of email users (Y) XY…
Q: i cant figure out why this part is wrong
A: (a) By the online regression calculator for the given data, the linear model for the number of…
Q: This is the following demand data: Period Demand 1 40 2 55 60 4 35 30 6. 52
A: Given information: The data represents the values of demand for the time periods 1 through 8.
Q: D) Assuming an initial forecast for week 1 of 15,000 miles, use exponential smoothing to compute…
A: Here use exponential smoothing forecasting formula
Q: Plot the following data on both semilog graph paper and standard rectangular coordinates. Drug A…
A:
Q: Convert the following trend equation into an annual basis : Ye = 50 + 0.5X where, the point of…
A:
Q: Use the following sales data: Week Sales 1 30 2…
A: a) We know that, in naive method we can calculate forecast value as, We get result as, Using…
Q: Two different forecasting techniques (F1 and F2) were used to forecast demand for cases of bottled…
A: we need to find MSE and MAPE MSE = Average(dev^2) = 253/8 = 31.62 MAPE = Average((abs…
Q: Consider the following quarterly demand level for electricity (in 1000 megawatts) in Mankweng from…
A: Hello! As you have posted more than 3 sub parts, we are answering the first 3 sub-parts. In case…
Q: Two different forecasting techniques (F1 and F2) were used to forecast demand for cases of bottled…
A:
Q: Determine whether the following PDE is equilibrium equation or dynamical equation. ng
A: Given: ∂u∂t=∂2u∂x2+∂2u∂y2-u
Q: A multiple regression analysis based on a data set that consists of 30 observation yielded the…
A: Solution: The given estimated demand equation is: Q =120-1.1P+0.04I+0.90A Where, P is price. I is…
Q: A fisherman has collected data about the length in inches, L, and weight in ounces, w, of fish he…
A: Given data : L represents length and W in weight.
Q: The number of kilograms of steam used per month by a chemical plant is thought to be related to the…
A: Since you have posted multiple questions , we will solve first question for you. To get the…
Q: Using Excel, Big Poppa's estimates the weekly demand function for its BBQ sandwiches to be Qª =…
A: Given information: The regression equation for the weekly demand function for its BBQ sandwiches is…
Q: A pharmaceutical manufacturer claims that a drug produced by it has an efficacy of 90%
A: Given : n=200 , X=160 , p0=0.90 , α=0.01 The estimate of the sample proportion is ,…
Q: Stratton, Inc., has collected the following information on its cost of electricity: Machine…
A:
Q: Production figures of a Textile industry are as follows : 1992 1993 1994 1995 1996 1997 1998 Year :…
A: The obtained trend line to estimate the production (in '000 units), using the year given as: Yt=a+bt…
Q: Fit a parabolic trend to the following tome - series data and estimate the production in 2022. Year…
A: Ans . The equation is y=a+bx+cx2 and the normal equations are ∑y=an+b∑x+c∑x2…
Q: Consider the following quarterly demand level for electricity (in 1000 megawatts) in Mankweng from…
A: Hello! As you have posted more than 3 sub parts, we are answering the first 3 sub-parts. In case…
Q: 5. Estimate the production for the years 2008 and 2010 with the help d following table : Year…
A:
Q: Consider the following quarterly demand level for electricity (in 1000 megawatts) in Mankweng from…
A: Demand: It is defined as the quantity of consumers willing and able to buy products at different…
Q: The following data were obtained for the growth of a tarsier population introduced into a new…
A:
Q: Given the following data on the number of pints of ice cream sold at a local ice cream store for a…
A: Given To find forecast demand for period 11 using 2-period moving average,
Q: (On inequal time interval) Obtain the straightline trend equation for the following data by the…
A: The objective is to find out the straight line trend equation for the given data , also compute the…
Q: The following equation describes the relationship between output and labor input at a sample of work…
A:
Q: Provide a bar chart (with data labels rounded to two decimal points) showing the average demand for…
A: Consider the following table:- Weekday Date Sum of Daily Demand Average Mon…
Q: Complete the table shown to the right for the population growth model for a certain country. k=…
A:
Q: Given the following information determine the linear regression model Sxx = 1106.56 Sxy=-41,112.65…
A: It is given that SXX=1106.56, SXY=-41,112.65 and B0 is 2627.82.
Q: grown to 193,755. (a) Assuming the population grows linearly, find the linear model, y = mx +b,…
A: Given query is to find the linear modal of population growth and the population in 2030.
Pls help me for this homwork -)

Step by step
Solved in 3 steps

- The Oxford Dictionary defines the word nominal asa value that is “stated or expressed but notnecessarily corresponding exactly to the real value.[18]Develop a reasonable argument for why the termnominal rate is used to describe the annual percentagerate of an investment account that compoundsinterest.The Fast Track Ski Shoppe sells ski goggles during the four months of the ski season.Average demand follows: a. Calculate the deseasonalized sales and the seasonal index for each of the fourmonths.b. If next year’s demand is forecast at 1200 pairs of goggles, what will be the forecast sales for each month?Suppose that the Perpetual Help College of Rizal had the following record of its growth of enrollment from 2011 -2020. Year Enrolment Year Enrolment 2011 5,200 2016 7,000 2012 5,500 2017 8,800 2013 6,000 2018 9,400 2014 6,500 2019 9,600 2015 6,800 2020 10,500 c) Using exponential smoothing and smoothing constant of .30 and 2011 previous forecast of 5200, develop a forecast of enrolment from 2012 to 2021. d) Forecast enrollment using Trend line Projection from 2011 to 2021. e) Evaluate forecast accuracy of each forecast model using MSE .…
- The snowboard industry has the following labour supply is ES = 150 + 10w and labour demand is ED = 350 – 10w, where E is the level of employment in 1,000s of workers and w is the hourly wage. If the labour market is competitive, then what is the equilibrium wage and employment? What is the unemployment rate? Let's pretend the government asks you to examine the impact of implementing a minimum hourly wage of $12. What would happen to the employment level? How many additional workers would want a job at the minimum wage? What is the unemployment rate? If the labour market is competitive, then what is the equilibrium wage and employment? What is the unemployment rate? Let's pretend the government asks you to examine the impact of implementing a minimum hourly wage of $12. What would happen to the employment level? How many additional workers would want a job at the minimum wage? What is the unemployment rate?Use the basic equation for the capital asset pricing model (CAPM) to Find the risk-free rate for a firm with a required return of 15% and a beta of 1.25 when the market return is 14%Apply the 3-years moving average method to forecast the required demand for the year 2021from the following historical data.Years 2012 2013 2014 2015 2016 2017 2018 2019 2020Demand 245 325 300 350 295 400 450 380 500
- The table below contains monthly (six months) demand estimates and working days per month. Month Demand Production Days JAN 1,500 20 FEB 1,200 24 MAR 1,000 25 APR 1,600 25 MAY 1,100 20 JUN 1,300 26 For the implementation of the “Level” strategy, the average demand (in units/day) over the six-month planning horizon is equal to;Mac Corp. is considering a project that has the following cash flow data. What is the project’s internal rate of return (IRR)? Year 0 1 2 3 Cash flow -$1,000 $425 $425 $425Show that the equivalent nominal interest and discount rates j(m) and d(m) the relationships consistent with the previous results.
- Use regression analysis on deseasonalized demand to forecast demand in summer 2013. Forecast for summer 2023 ______- Given the following demand. What is the forecast for period 6 and 15. (a = .40 and b = .70 ) Period demand base trend forecast -------- ---------- ----------- --------- ---------- 1 50 2 70 3 60 70 15 4 90 5 100 6Given the following average demand for each month, calculate the seasonal indicesfor each month.