Based on the information in the following table, use the THREE-MONTH MOVING AVERAGE Approach to forecast the demand for periods 4-12 PERIOD MONTH Demand Forecast Jan 57 Feb 69 3. Mar 210 Apr 54 5. May 207 Jun 108 7. Jul 210 Aug 78 Sep 156 10 Oct 114 11 Nov 135 12 Dec 171
Based on the information in the following table, use the THREE-MONTH MOVING AVERAGE Approach to forecast the demand for periods 4-12 PERIOD MONTH Demand Forecast Jan 57 Feb 69 3. Mar 210 Apr 54 5. May 207 Jun 108 7. Jul 210 Aug 78 Sep 156 10 Oct 114 11 Nov 135 12 Dec 171

MATLAB: An Introduction with Applications
6th Edition
ISBN:9781119256830
Author:Amos Gilat
Publisher:Amos Gilat
Chapter1: Starting With Matlab
Section: Chapter Questions
Problem 1P

Related questions
Question
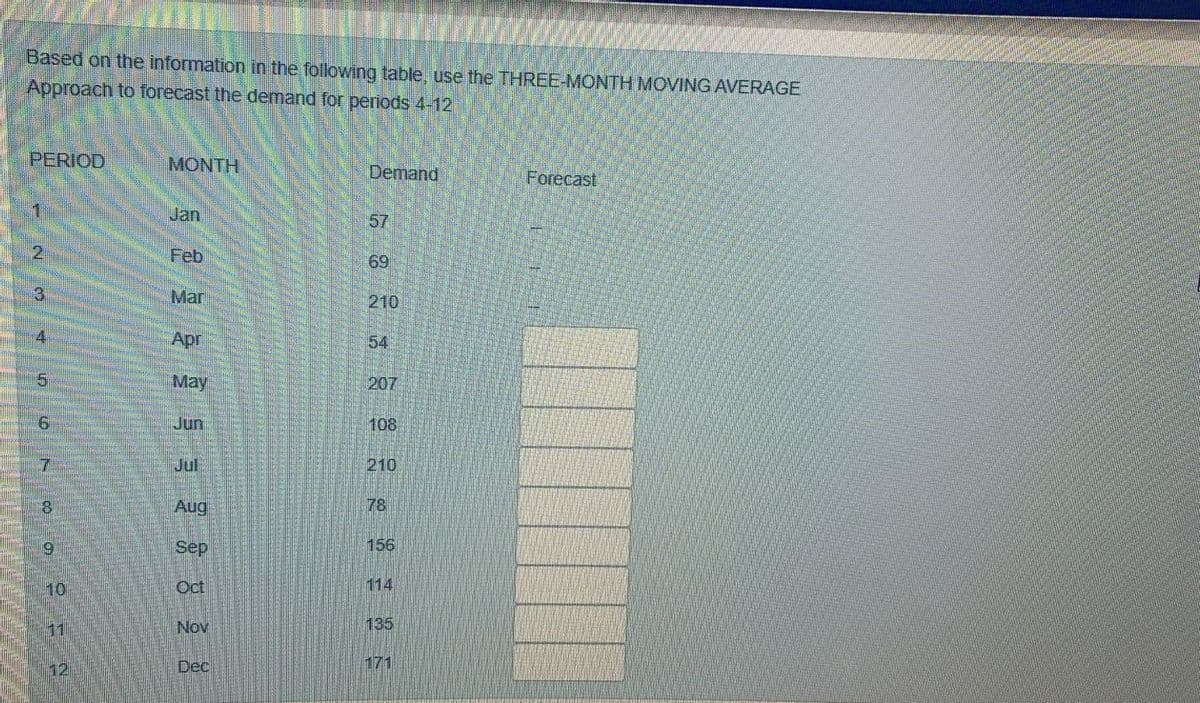
Transcribed Image Text:Based on the information in the following table, use the THREE-MONTH MOVING AVERAGE
Approach to forecast the demand for periods 4-12
PERIOD
MONTH
Demand
Forecast
Jan
57
2.
Feb
69
3.
Mar
210
Apr
54
May
207
Jun:
108
7.
Jul
210
Aug
78
69
Sep
156
10
Oct
114
11
Nov
135
12
Dec
171
Expert Solution
This question has been solved!
Explore an expertly crafted, step-by-step solution for a thorough understanding of key concepts.

Step by step
Solved in 2 steps with 2 images

Knowledge Booster


Learn more about
Need a deep-dive on the concept behind this application? Look no further. Learn more about this topic, statistics and related others by exploring similar questions and additional content below.Recommended textbooks for you
MATLAB: An Introduction with Applications
Statistics
ISBN:
9781119256830
Author:
Amos Gilat
Publisher:
John Wiley & Sons Inc

Probability and Statistics for Engineering and th…
Statistics
ISBN:
9781305251809
Author:
Jay L. Devore
Publisher:
Cengage Learning

Statistics for The Behavioral Sciences (MindTap C…
Statistics
ISBN:
9781305504912
Author:
Frederick J Gravetter, Larry B. Wallnau
Publisher:
Cengage Learning
MATLAB: An Introduction with Applications
Statistics
ISBN:
9781119256830
Author:
Amos Gilat
Publisher:
John Wiley & Sons Inc
Probability and Statistics for Engineering and th…
Statistics
ISBN:
9781305251809
Author:
Jay L. Devore
Publisher:
Cengage Learning
Statistics for The Behavioral Sciences (MindTap C…
Statistics
ISBN:
9781305504912
Author:
Frederick J Gravetter, Larry B. Wallnau
Publisher:
Cengage Learning

Elementary Statistics: Picturing the World (7th E…
Statistics
ISBN:
9780134683416
Author:
Ron Larson, Betsy Farber
Publisher:
PEARSON

The Basic Practice of Statistics
Statistics
ISBN:
9781319042578
Author:
David S. Moore, William I. Notz, Michael A. Fligner
Publisher:
W. H. Freeman

Introduction to the Practice of Statistics
Statistics
ISBN:
9781319013387
Author:
David S. Moore, George P. McCabe, Bruce A. Craig
Publisher:
W. H. Freeman